Financial Features Case Study
Years: 2022 & 2024
Role: Lead Product/UX Researcher
Context:
2023 was a difficult year for the short term rental industry with a drop in revenue of 13% YoY and down 19% when compared to 2021 figures.
Faced with increasing pressure from homeowners to improve revenue, Vacasa was caught between a struggling market and owners with expectations that did not align with the current market conditions.
Problem:
Because homeowners weren’t making as much revenue as they did in previous years, they were less trusting of how Vacasa was pricing their home. The call center was being inundated with revenue related concerns and product was tasked with increasing engagement with homeowners to better communicate the nature of their decreased revenue — at scale.
Foundational & Generative Research
The thing with foundational research is that it’s a gift that just keeps on giving. In 2023, I executed a foundational user research study that consisted of 1:1 in-depth user interviews and a large survey. This work served as the foundation for our financial features project.
Conducted 20 in depth interviews with a mix of user demographics and regions.
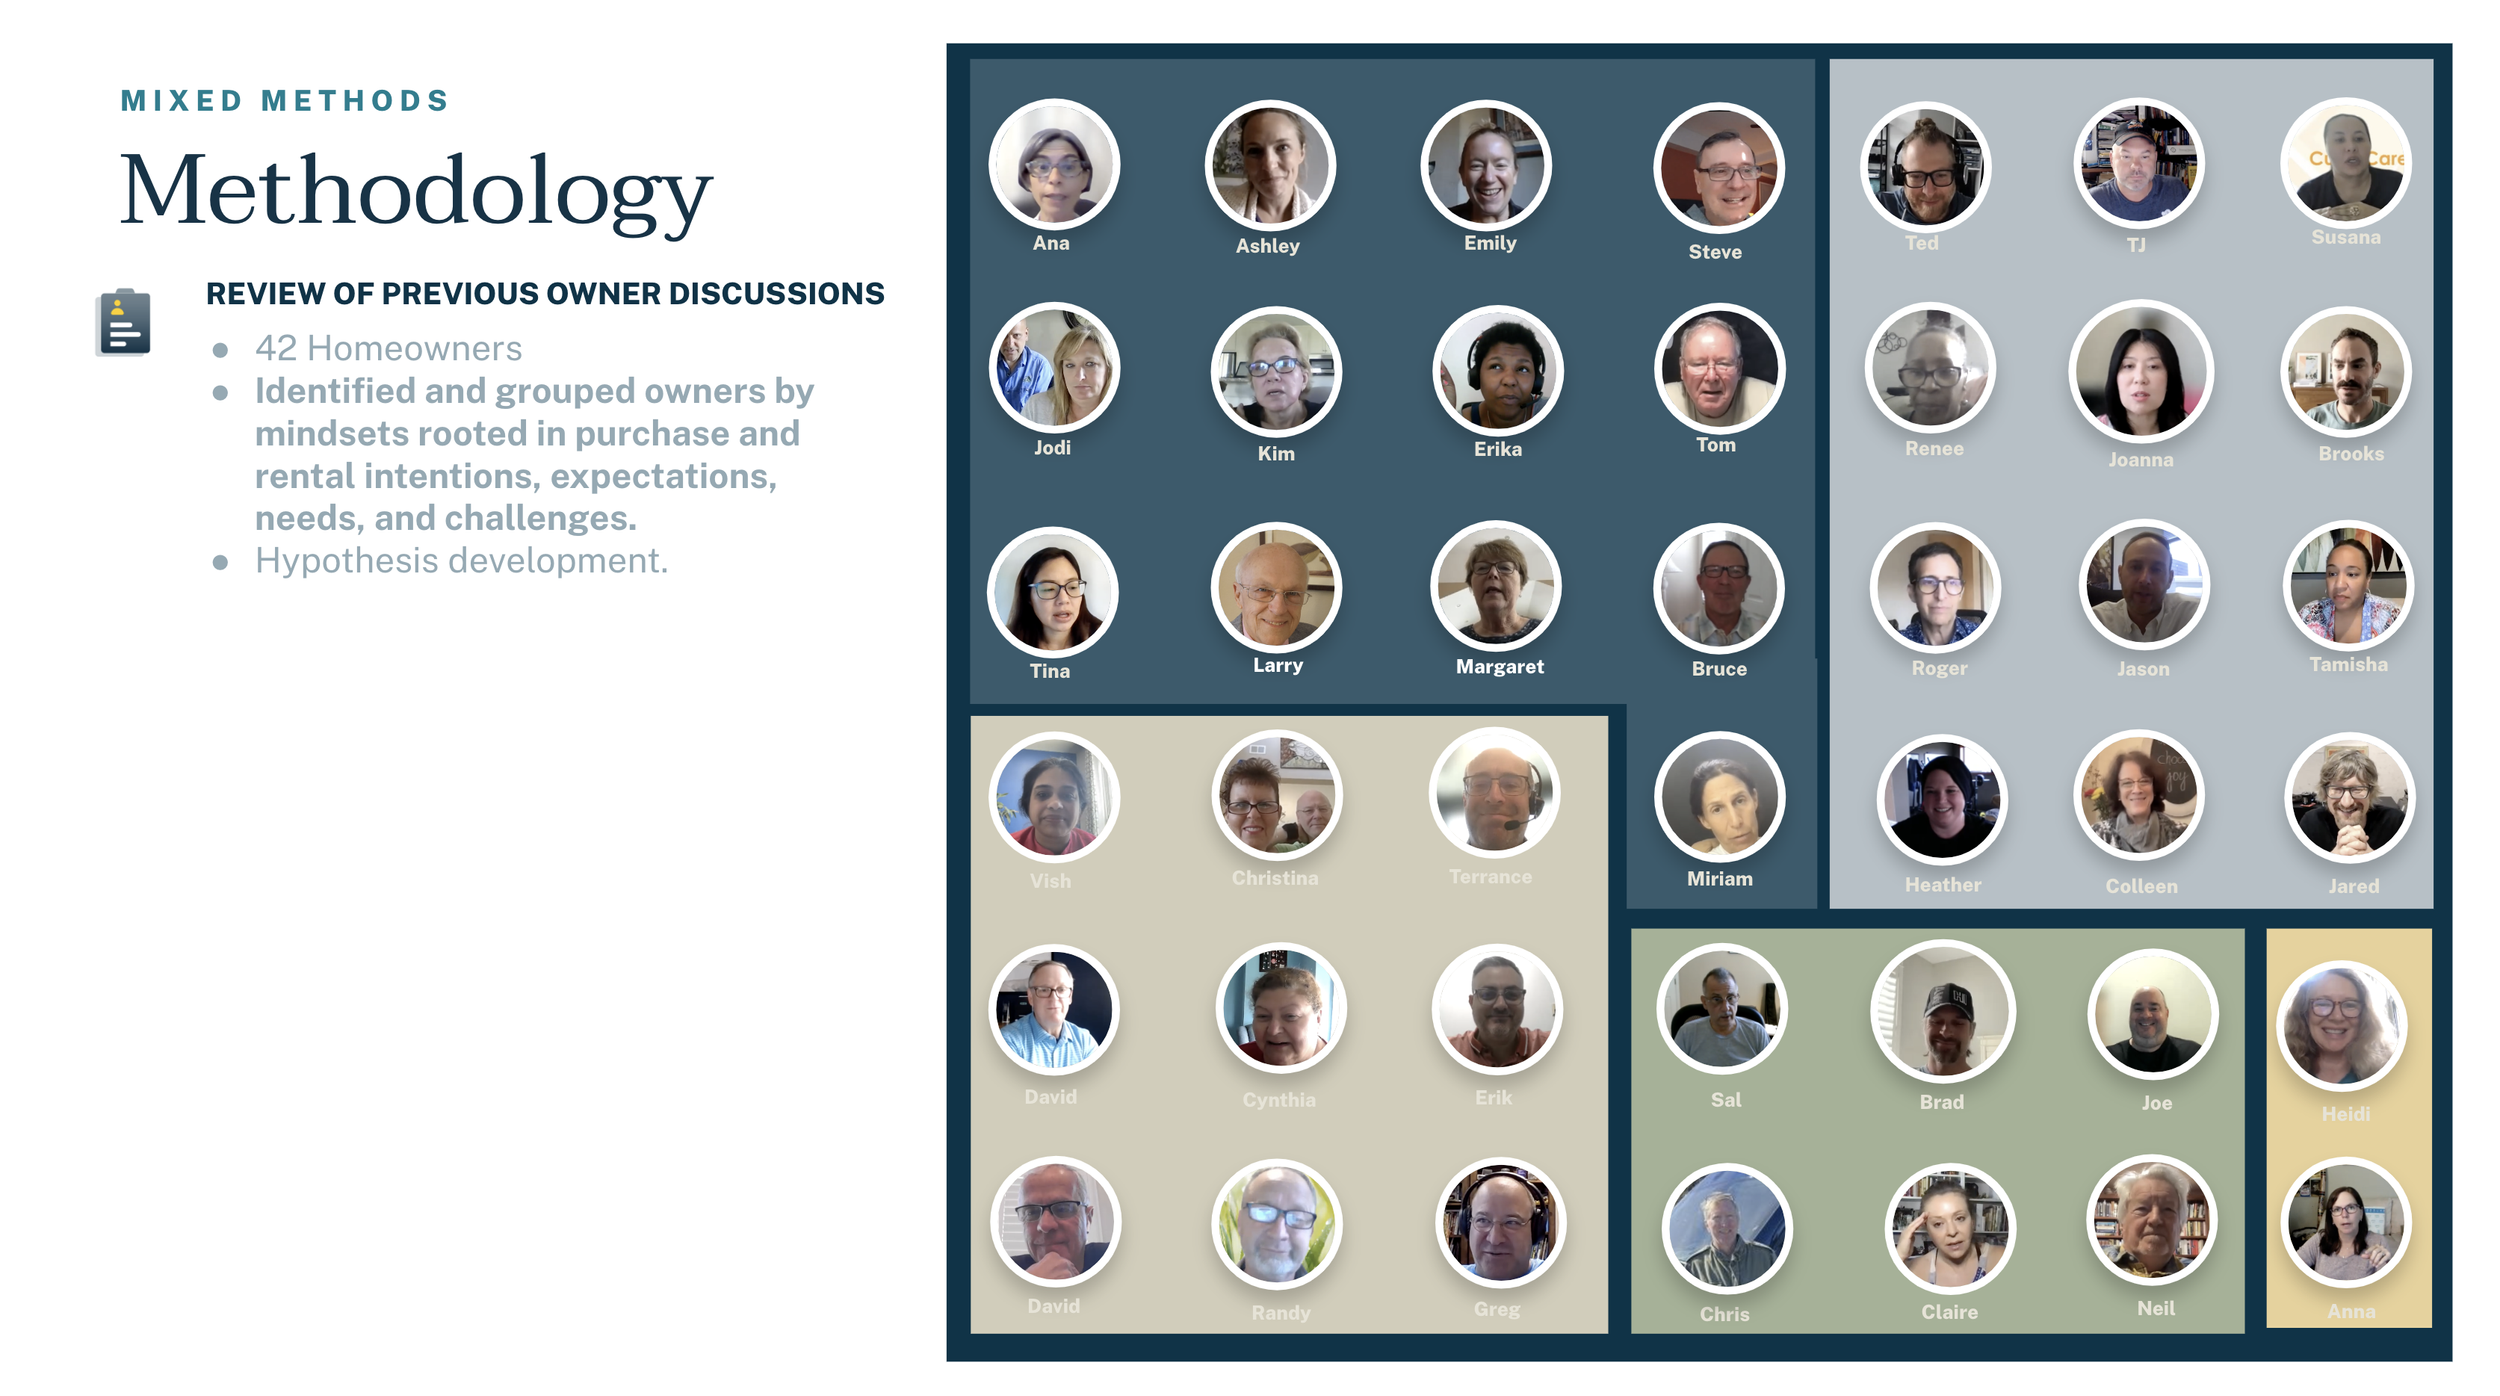
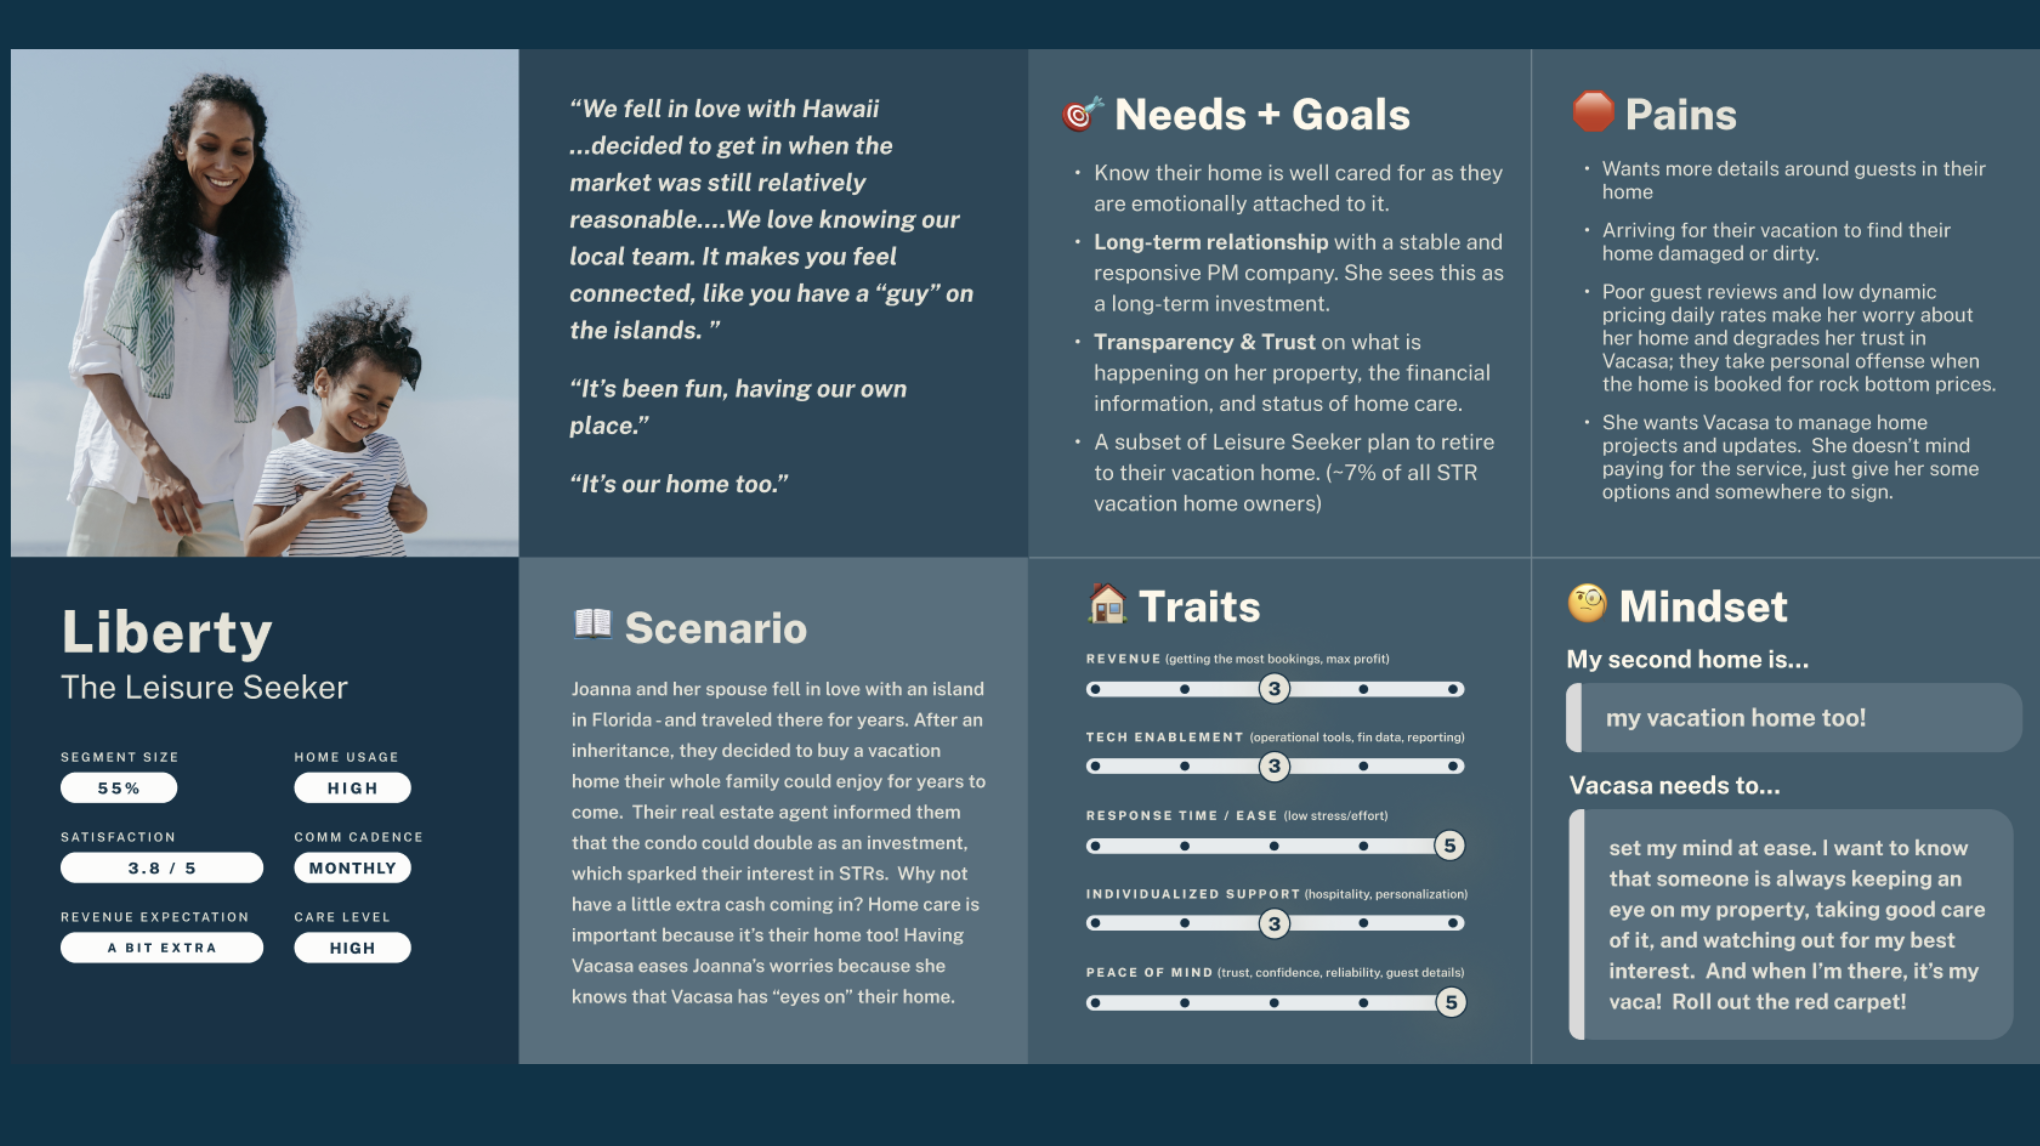
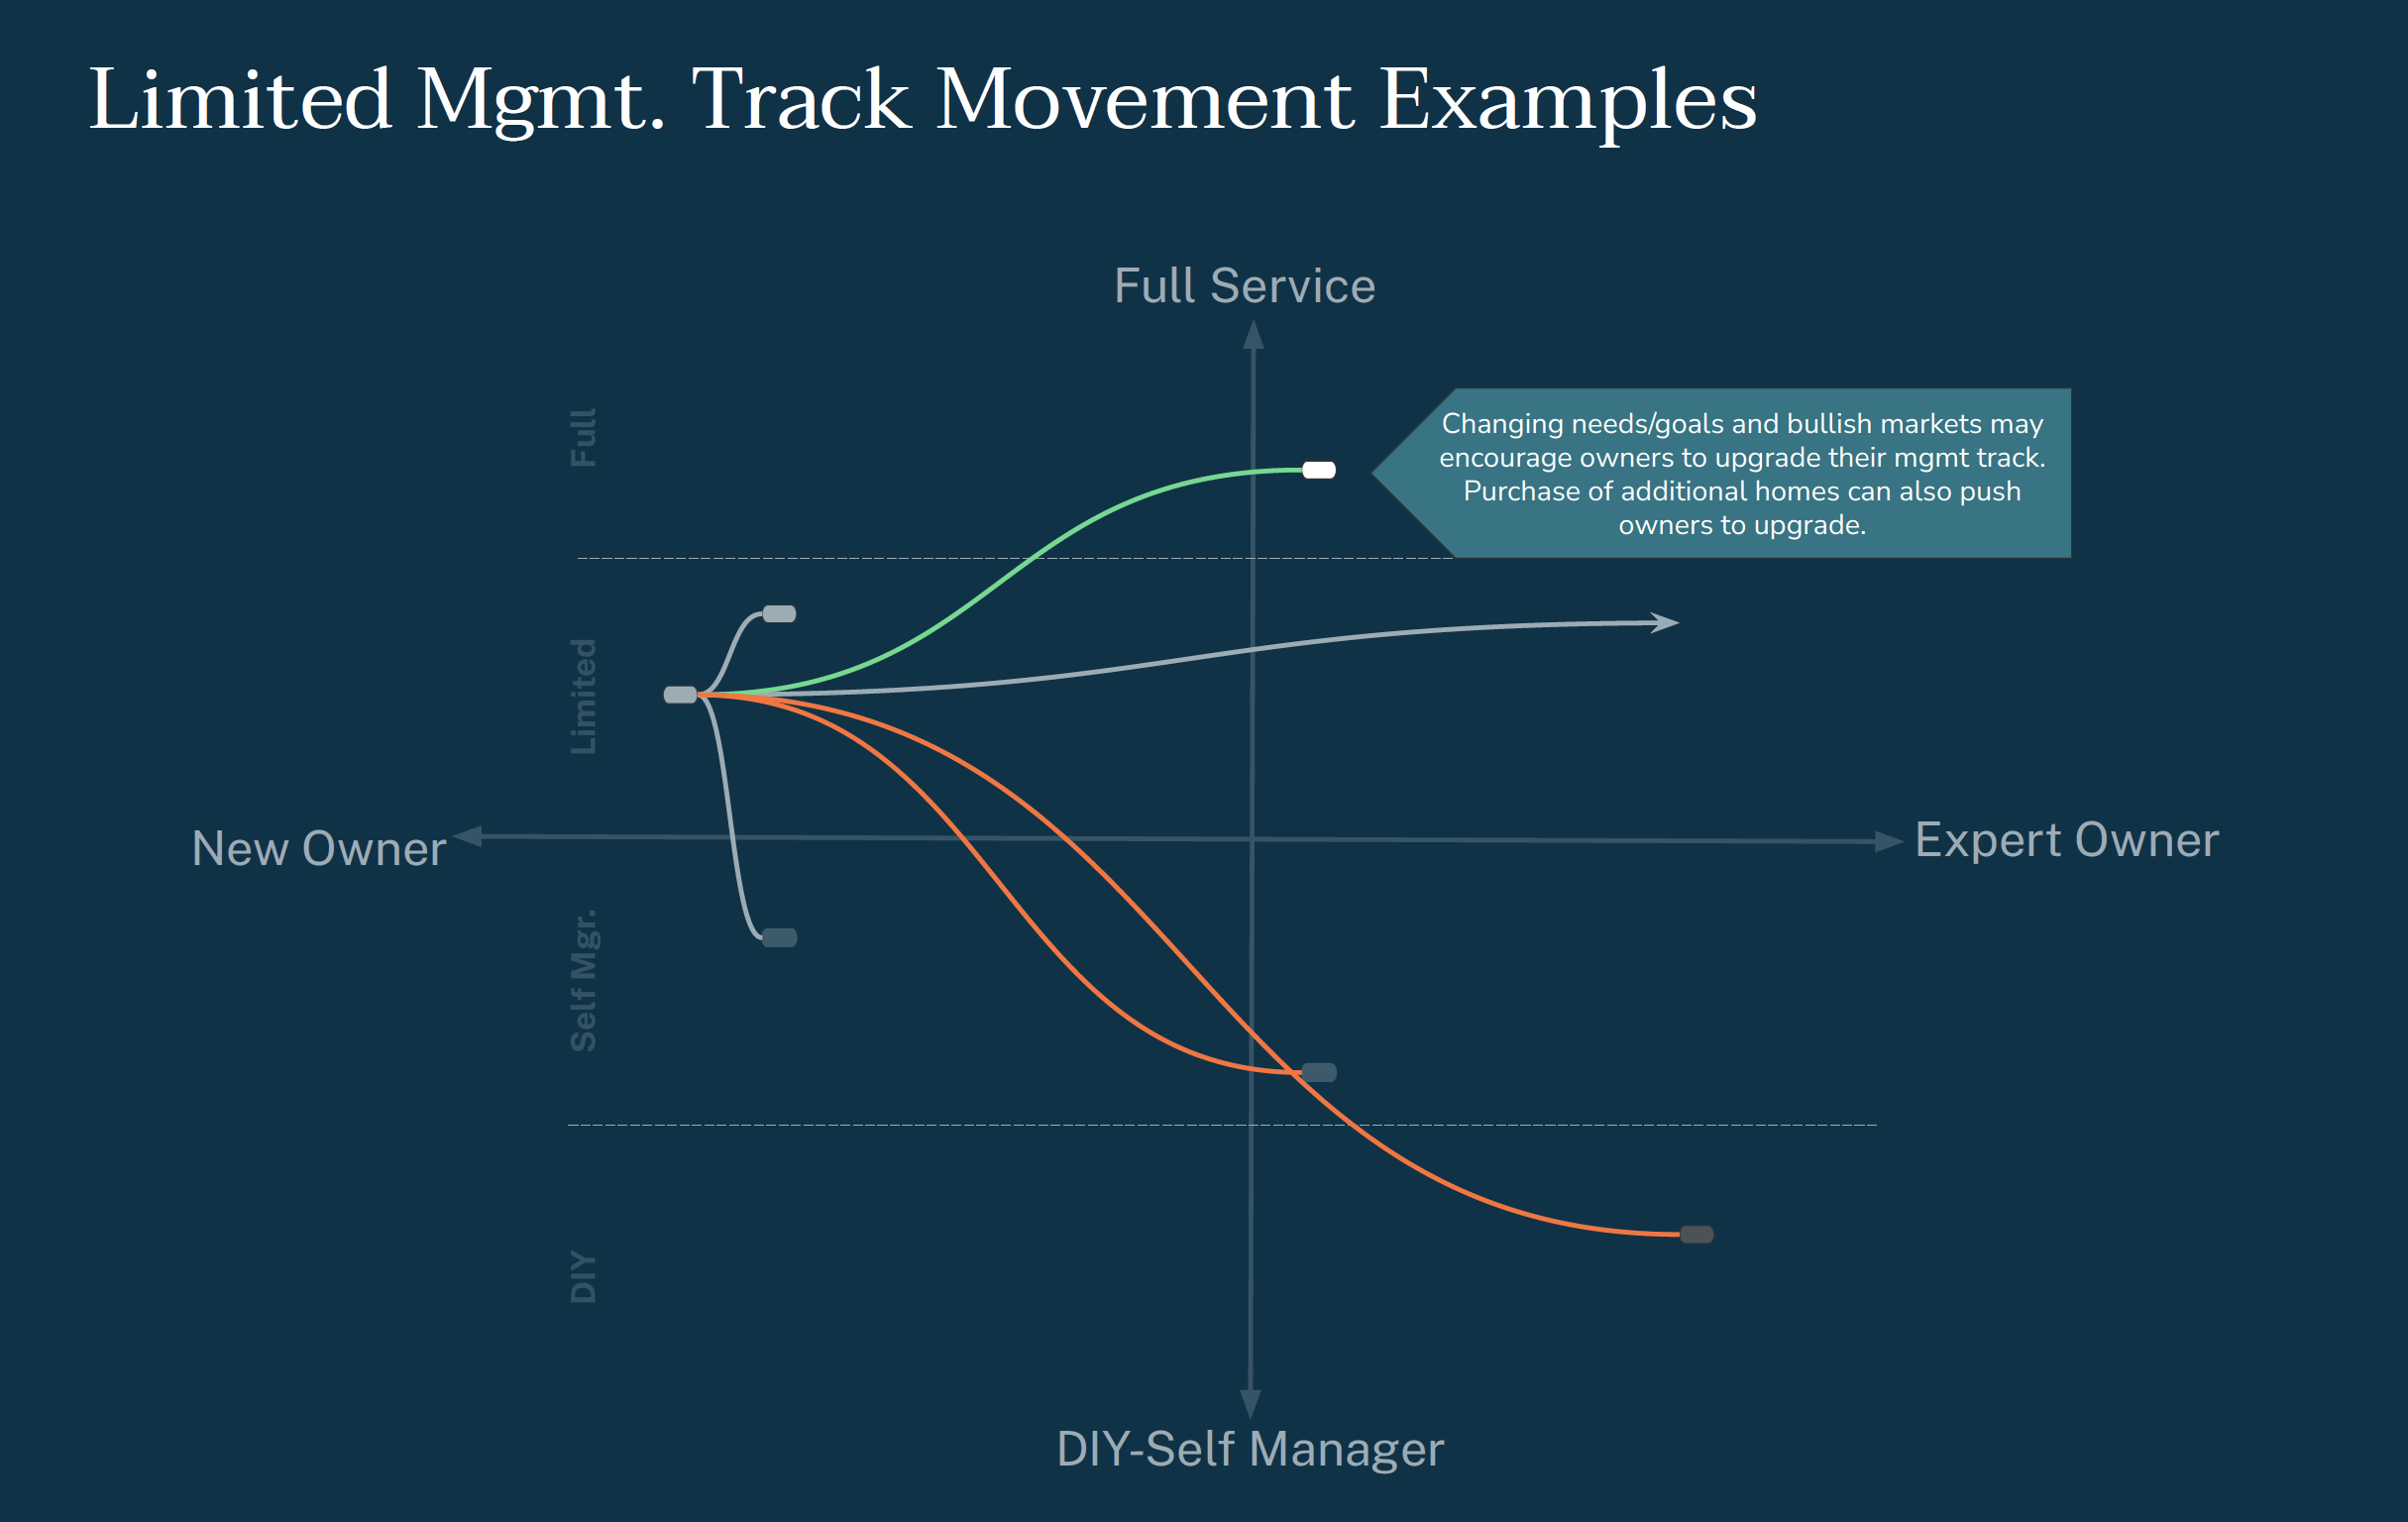
From these interviews, I identified preliminary personas, grouping them by their mindset which was rooted in purchase and rental intentions, expectations, needs, goals, and challenges.
I also reviewed previously conducted in-depth interviews to validate my segments.
From the qualitative interviews, I also documented a list of over 150 user needs.
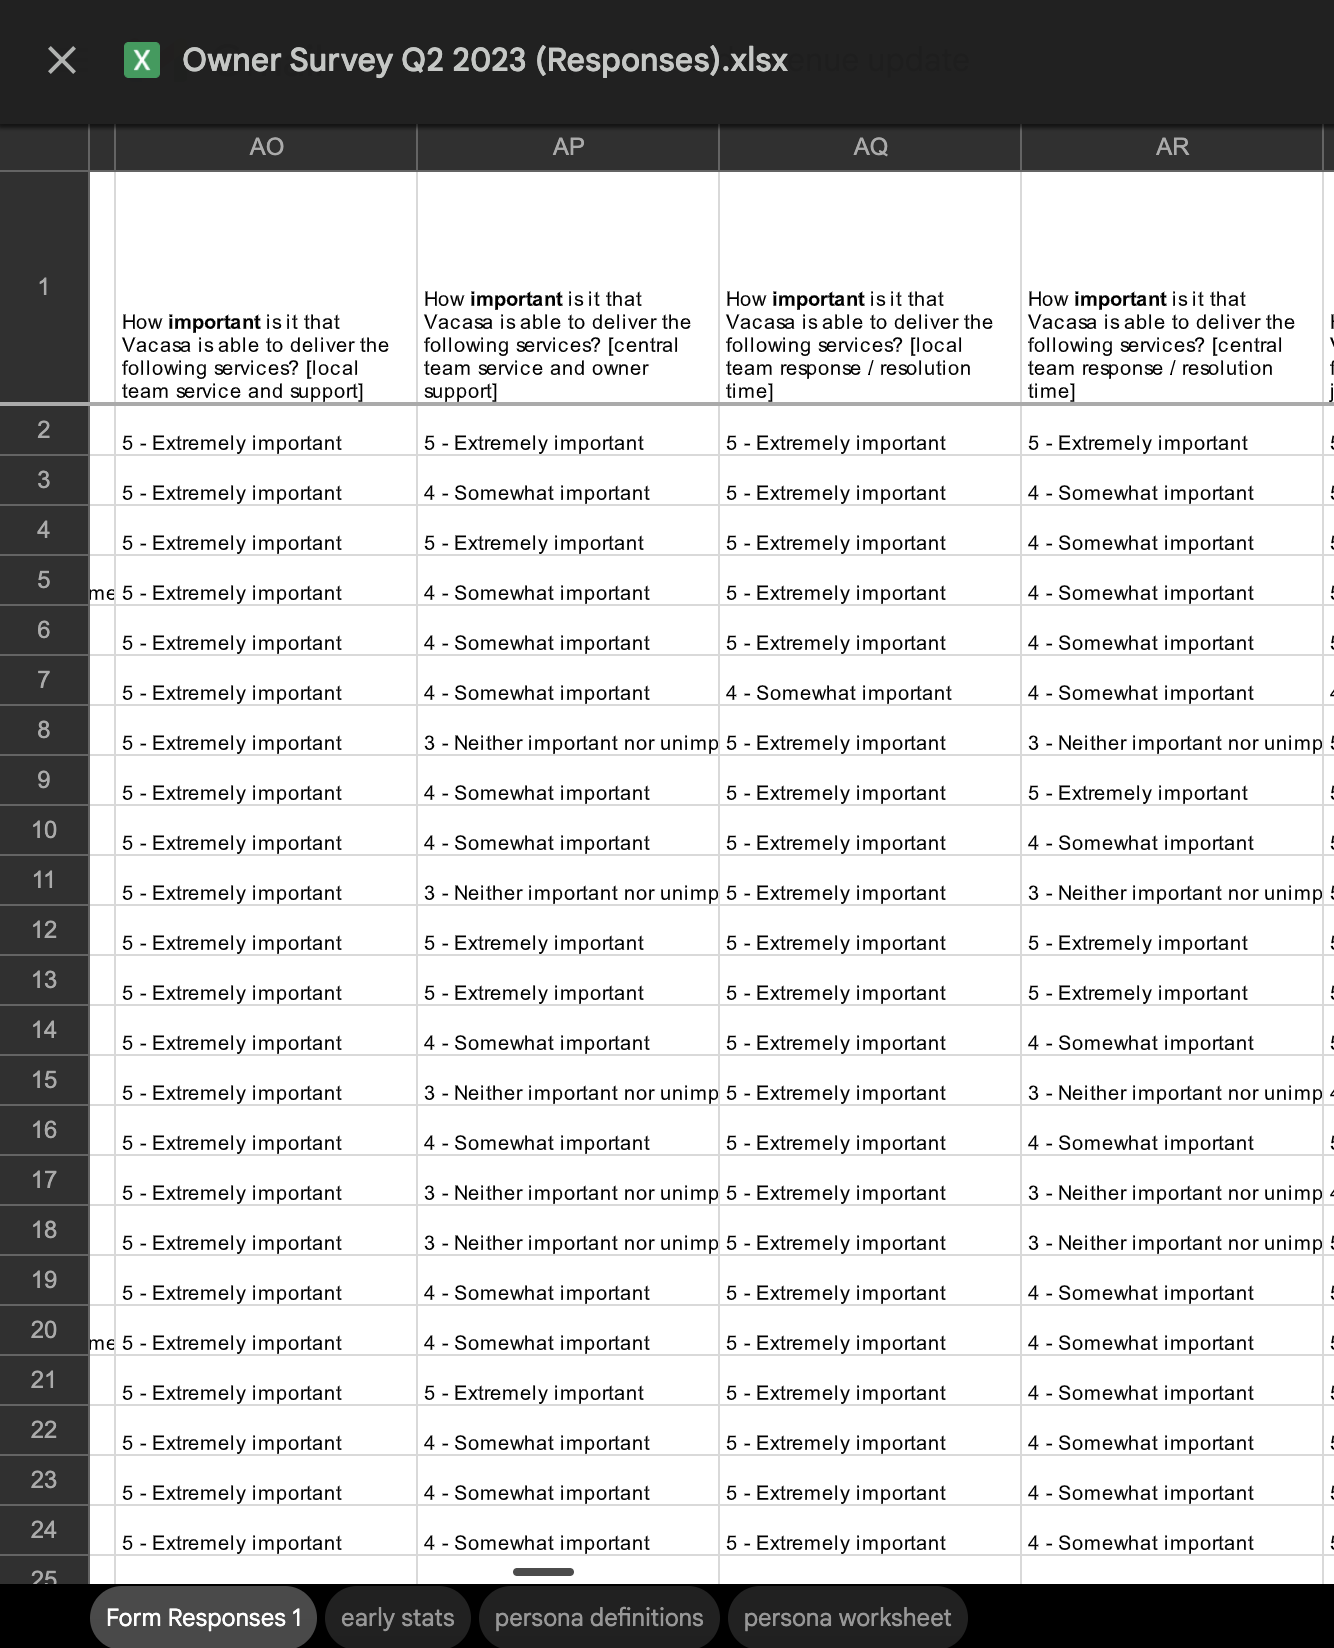
After the qualitative research and analysis was complete, I designed and conducted a user survey which was completed by ~500 homeowners.
The objective of the survey to understand the importance and satisfaction of each need that was identified in the qualitative research.
Analysis
A summary of each analysis step is below:
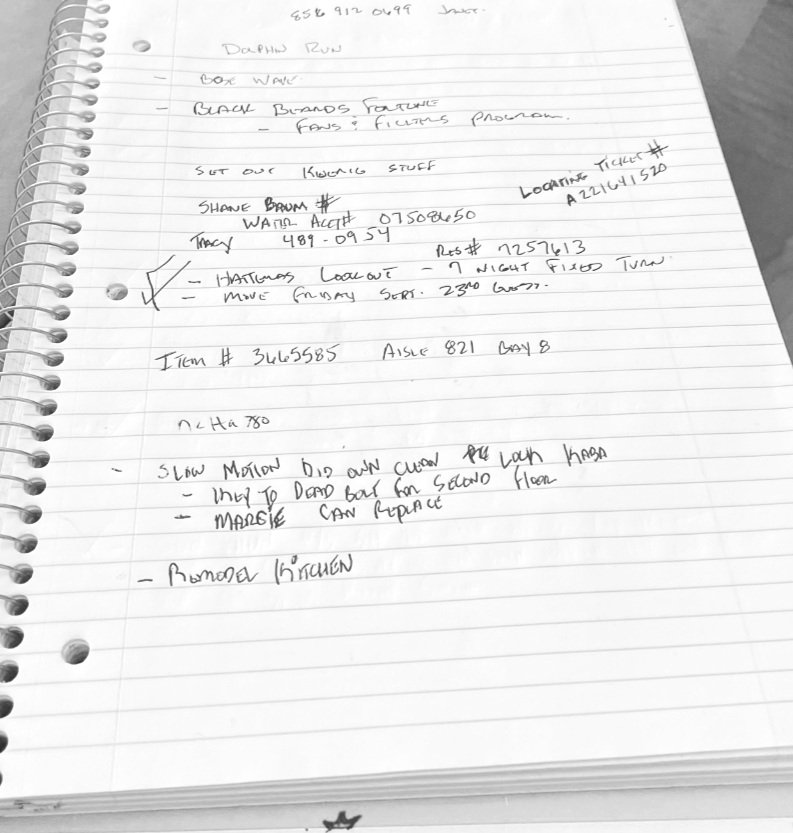
Qualitative Interviews: Depending on the project, I use a combination of spreadsheets and Figjam to organize and analyze text data. I also lean heavily on doing analysis within video editing tools (e.g. Adobe Premiere Pro) because I feel that there is a large amount of tonal and non-verbal cues that are lost in reading transcripts. Also, any handwritten notes that I have are translated into stickie blurbs and placed in the Figjam file. Once I’ve dumped all of the notes and quotes onto the board, I’ll organize them in an affinity fashion, which works well for surfacing larger themes and tiny nuances.
Quantitative survey data: I have used Qualtrics and similar tools in the past, however, at Vacasa we used Google Forms. If I needed something quick, sometimes I utilized Google’s analysis and data visualizations, but typically I needed a more detailed analysis so I would download the data and manipulate it in Excel using the filtering, pivot, and visualization functionalities.
Persona Development
Plus, anti-personas
When I arrived at Vacasa they had a set of design personas however. they needed an update.
Across the business, there was a lot of confusion at Vacasa about what personas were and how to use them so throughout my time there, I used every opportunity I could to help educate on various tools and methods.
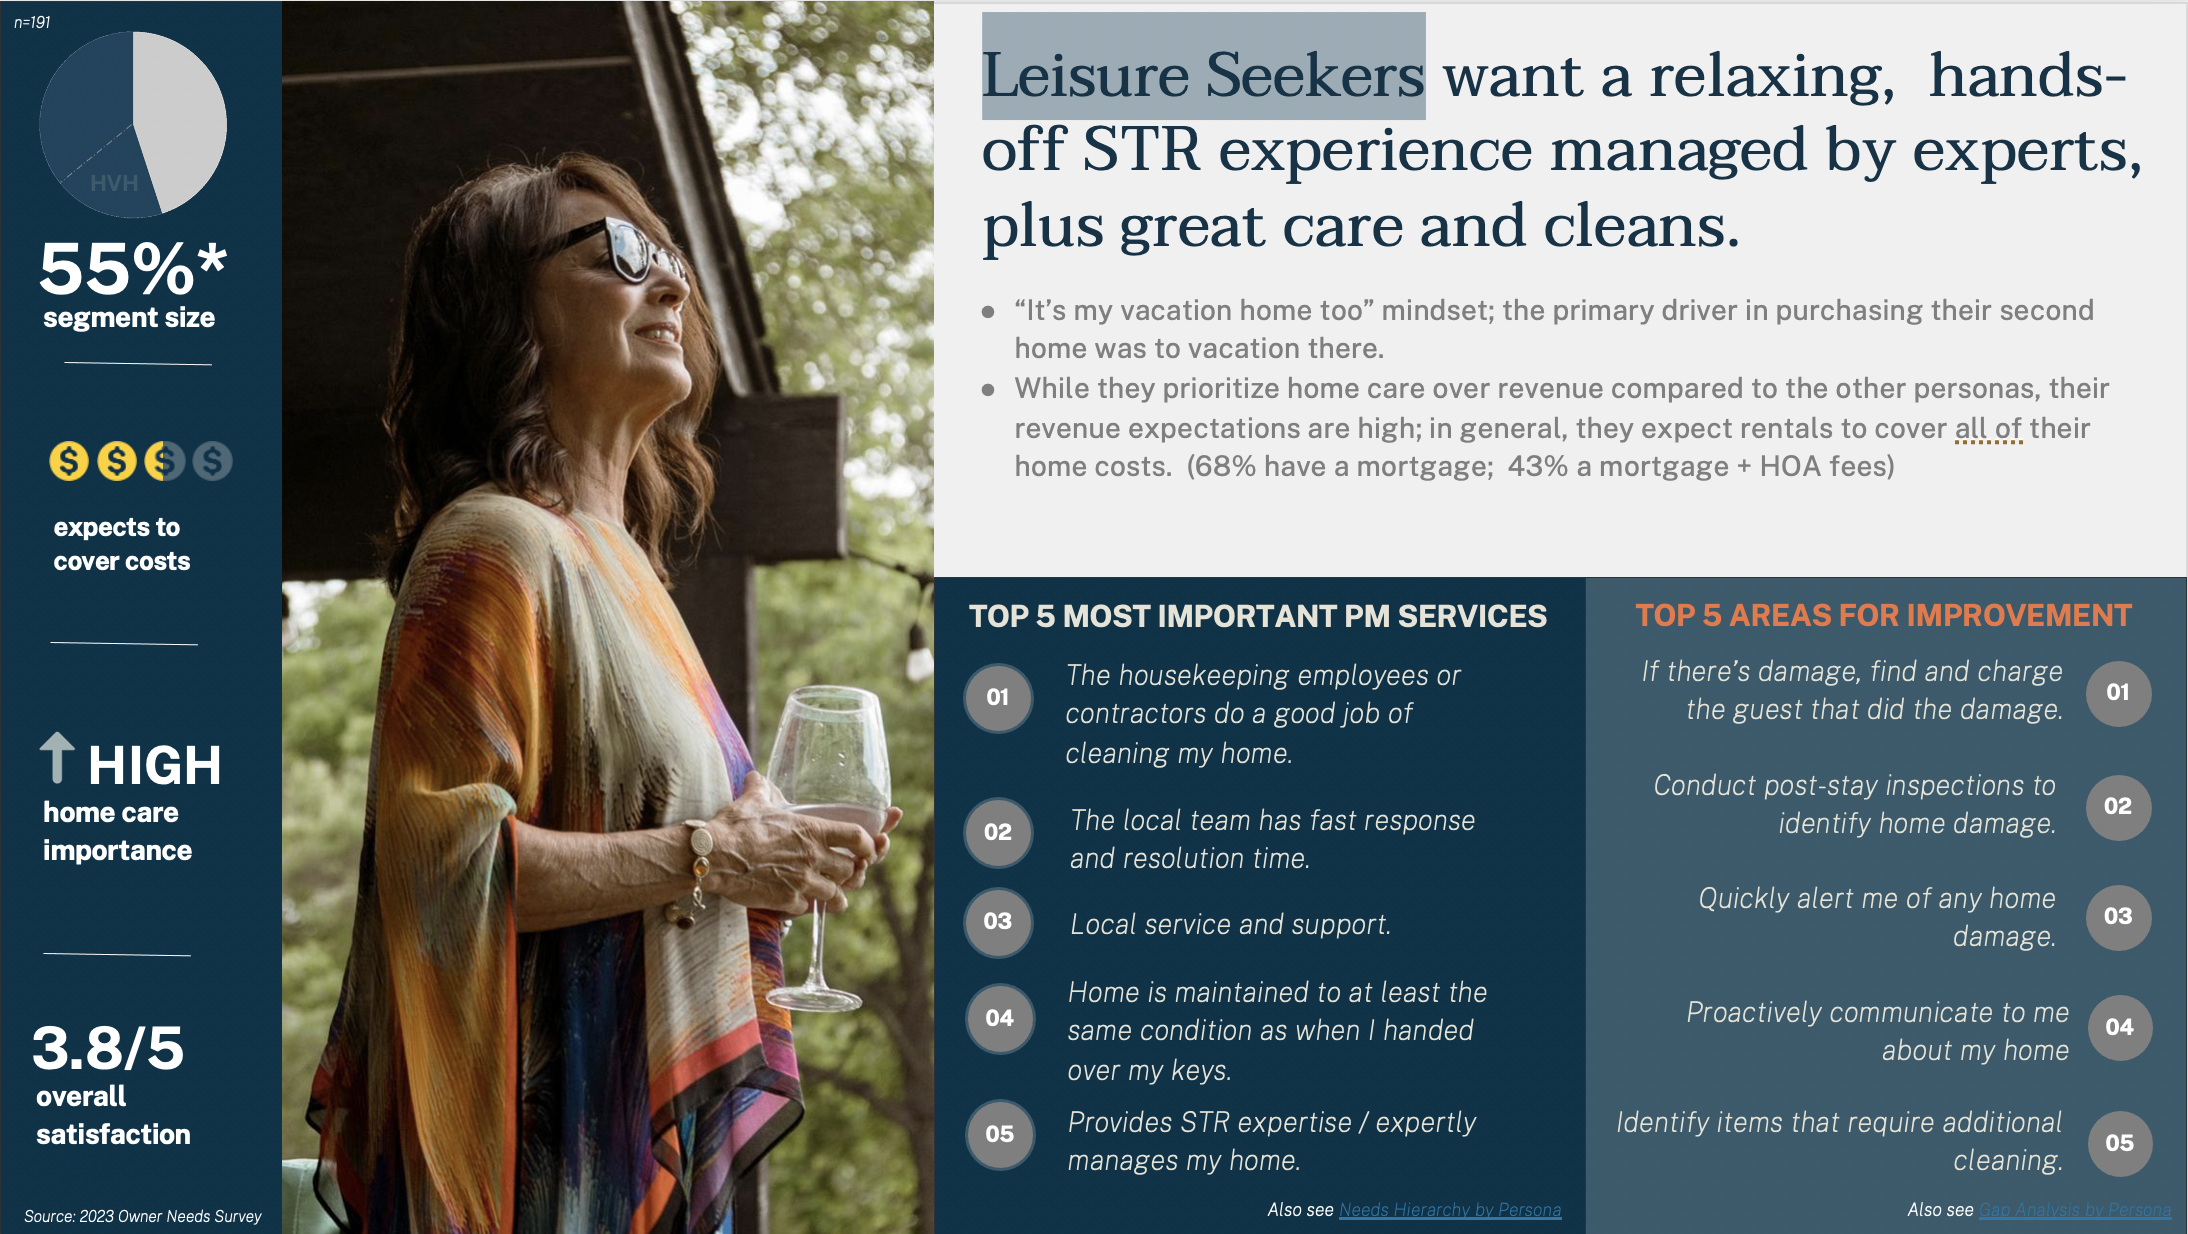
For these personas, I and grouped owners by mindset, rooted in purchase and rental intentions, expectations, needs, goals, and challenges.
Sometimes in persona development, researchers or designers choose to include fictitious vignettes within each persona group. Because of the existing confusion around personas at Vacasa, I chose to not include these types of vignettes, instead I included real life stories from the homeowners that I interviewed.
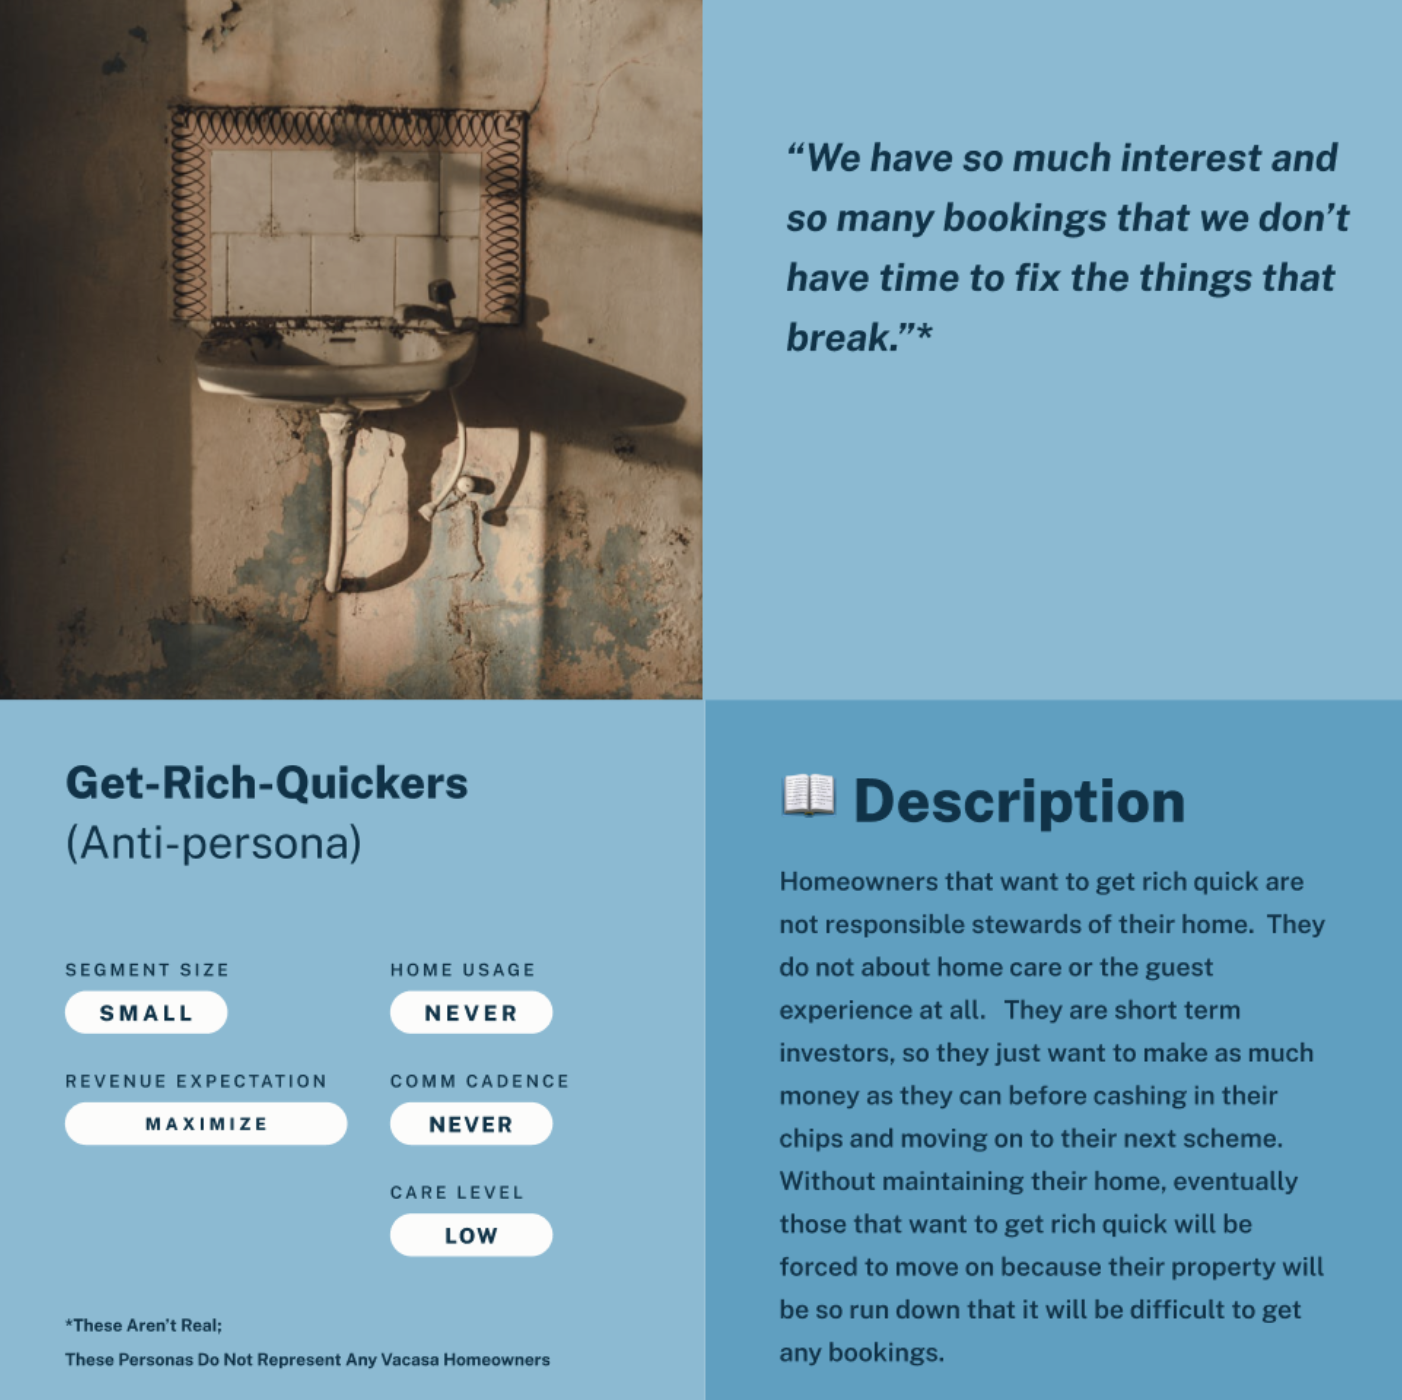
There was also a misconception that some homeowners don’t care about certain aspects of home care. The data refuted this but the concept persisted. To help socialize the importance of home care with our target users, I created a series of “anti-personas” which communicated that the users that were renting their homes but did not care about home care were not our target.
The marketing team was excited about the persona work that I was doing and asked me to translate some of the design personas into marketing personas.
Journey Map Development
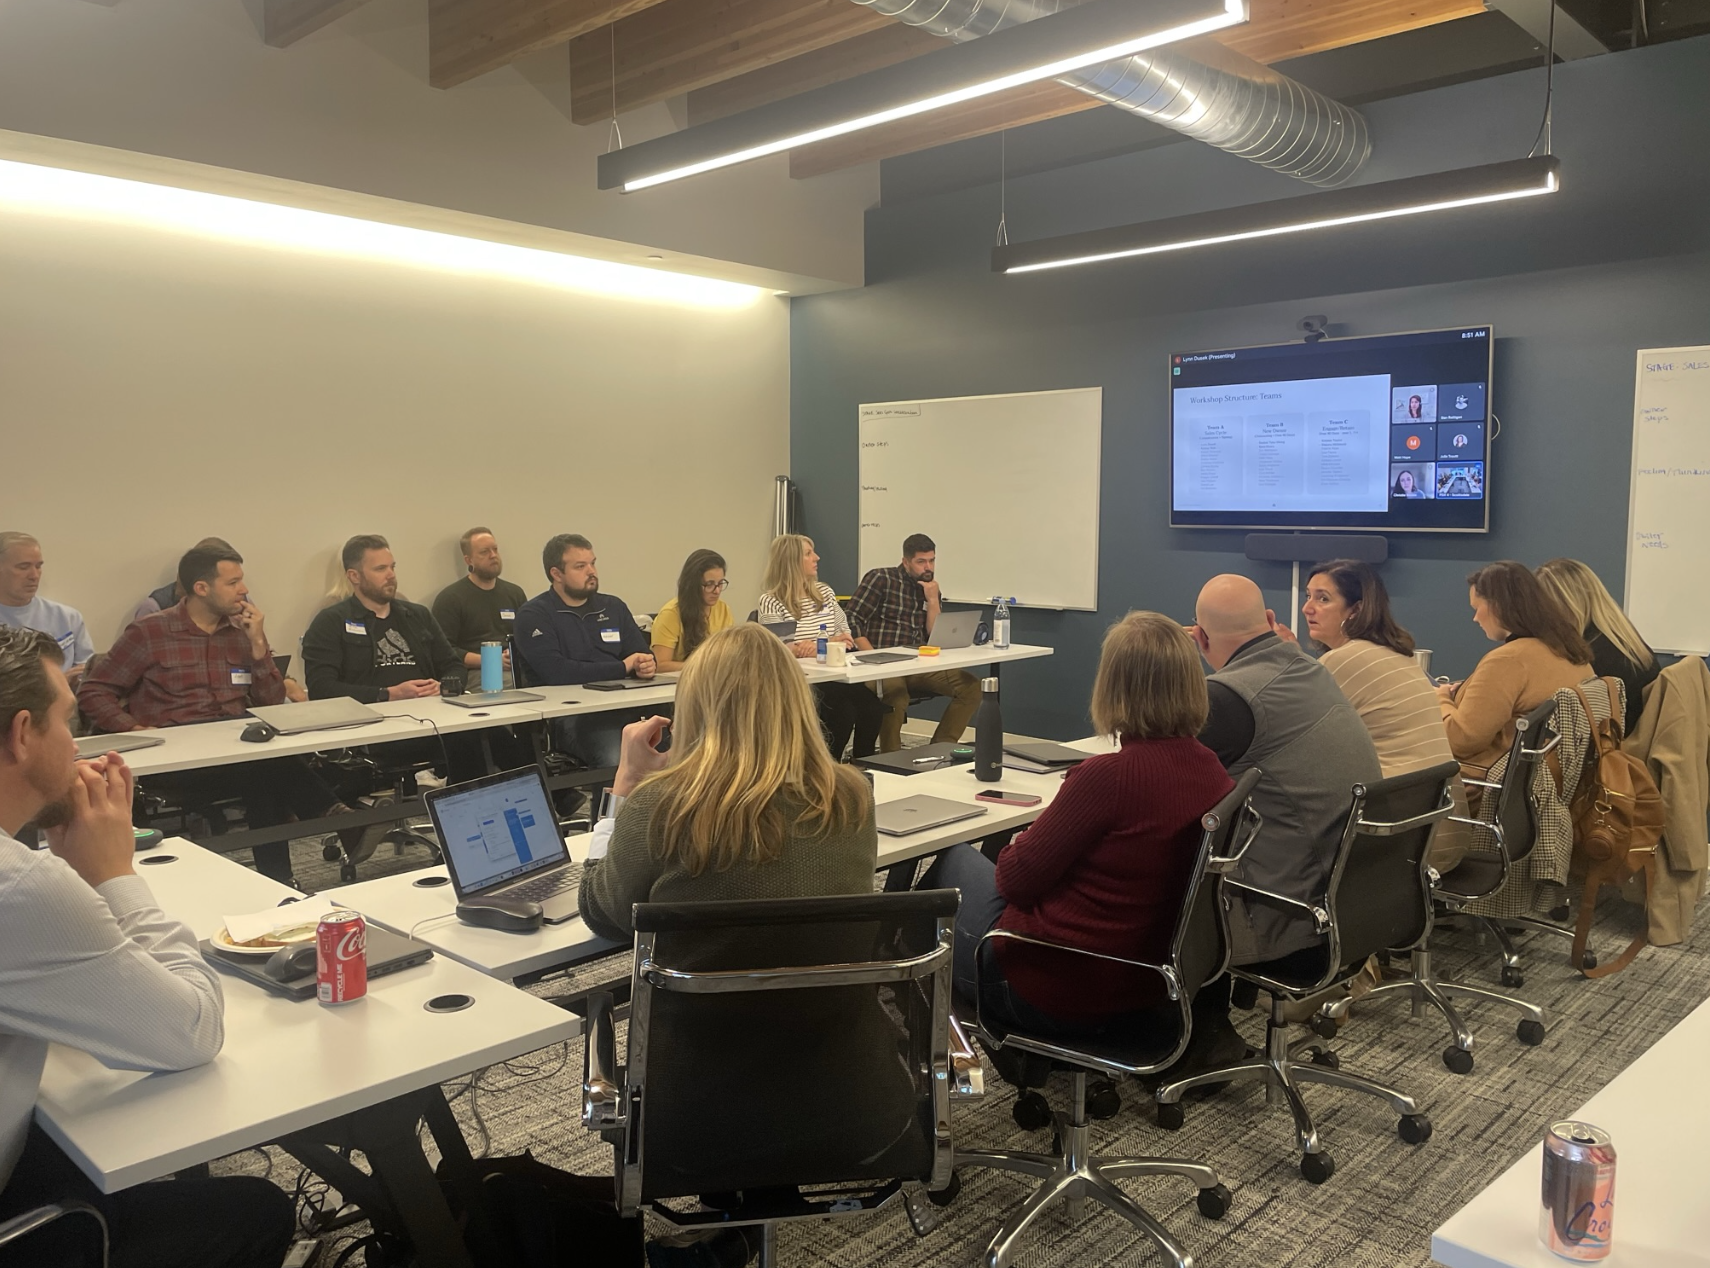
I helped to plan and run Vacasa’s Journey Mapping event that was held at the headquarters in Portland, Oregon, and was also a key speaker.
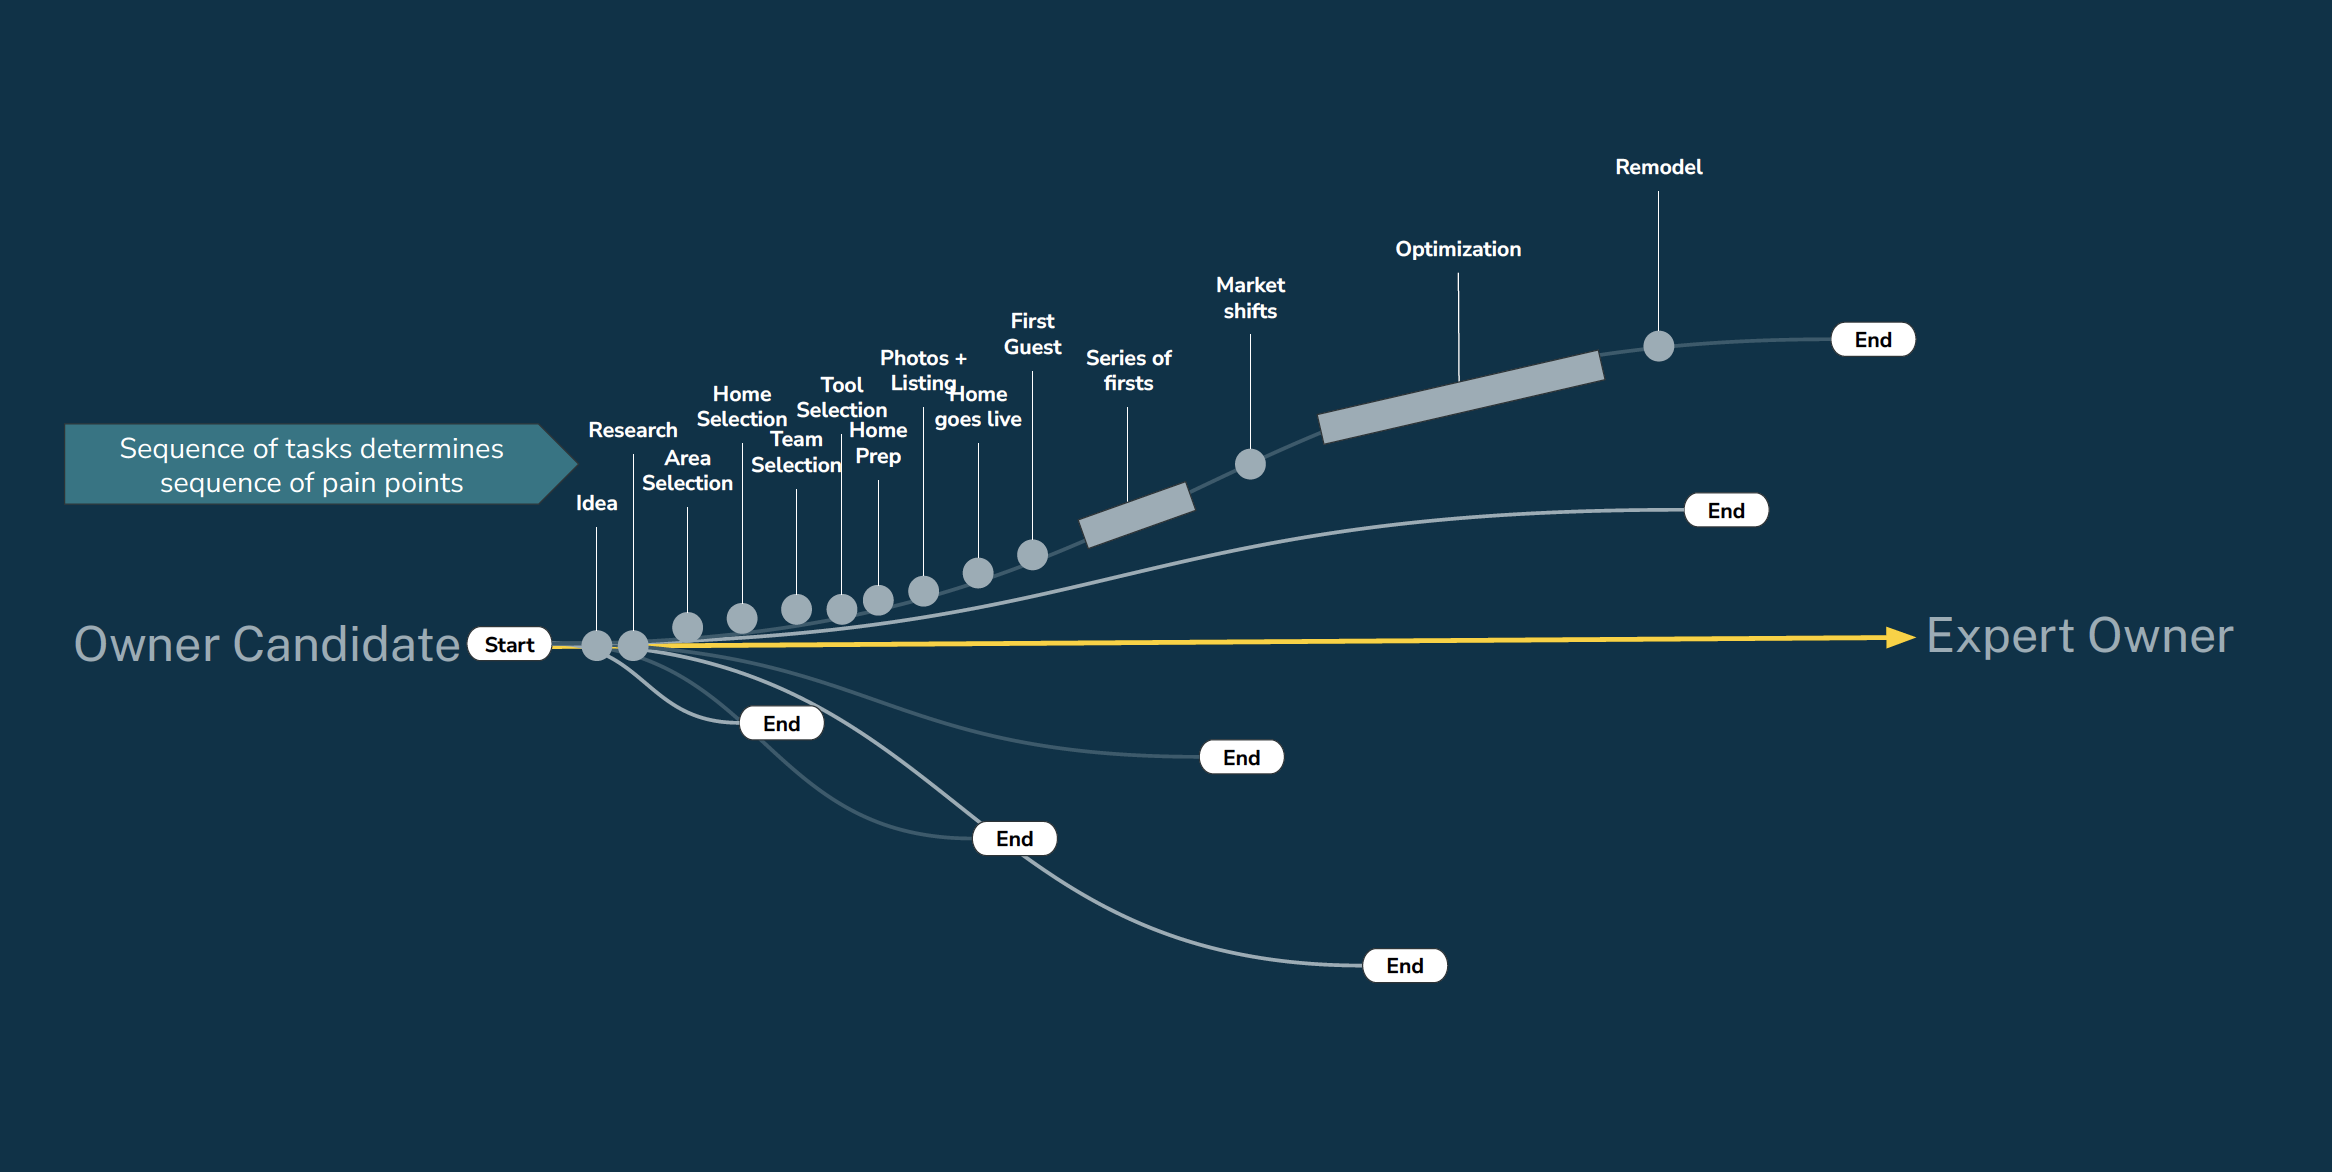
Prior to the event, the core group of event leaders closely collaborated to create a survey that was sent out to user-facing field employees. I used the data from this survey to create a journey “skeleton”.
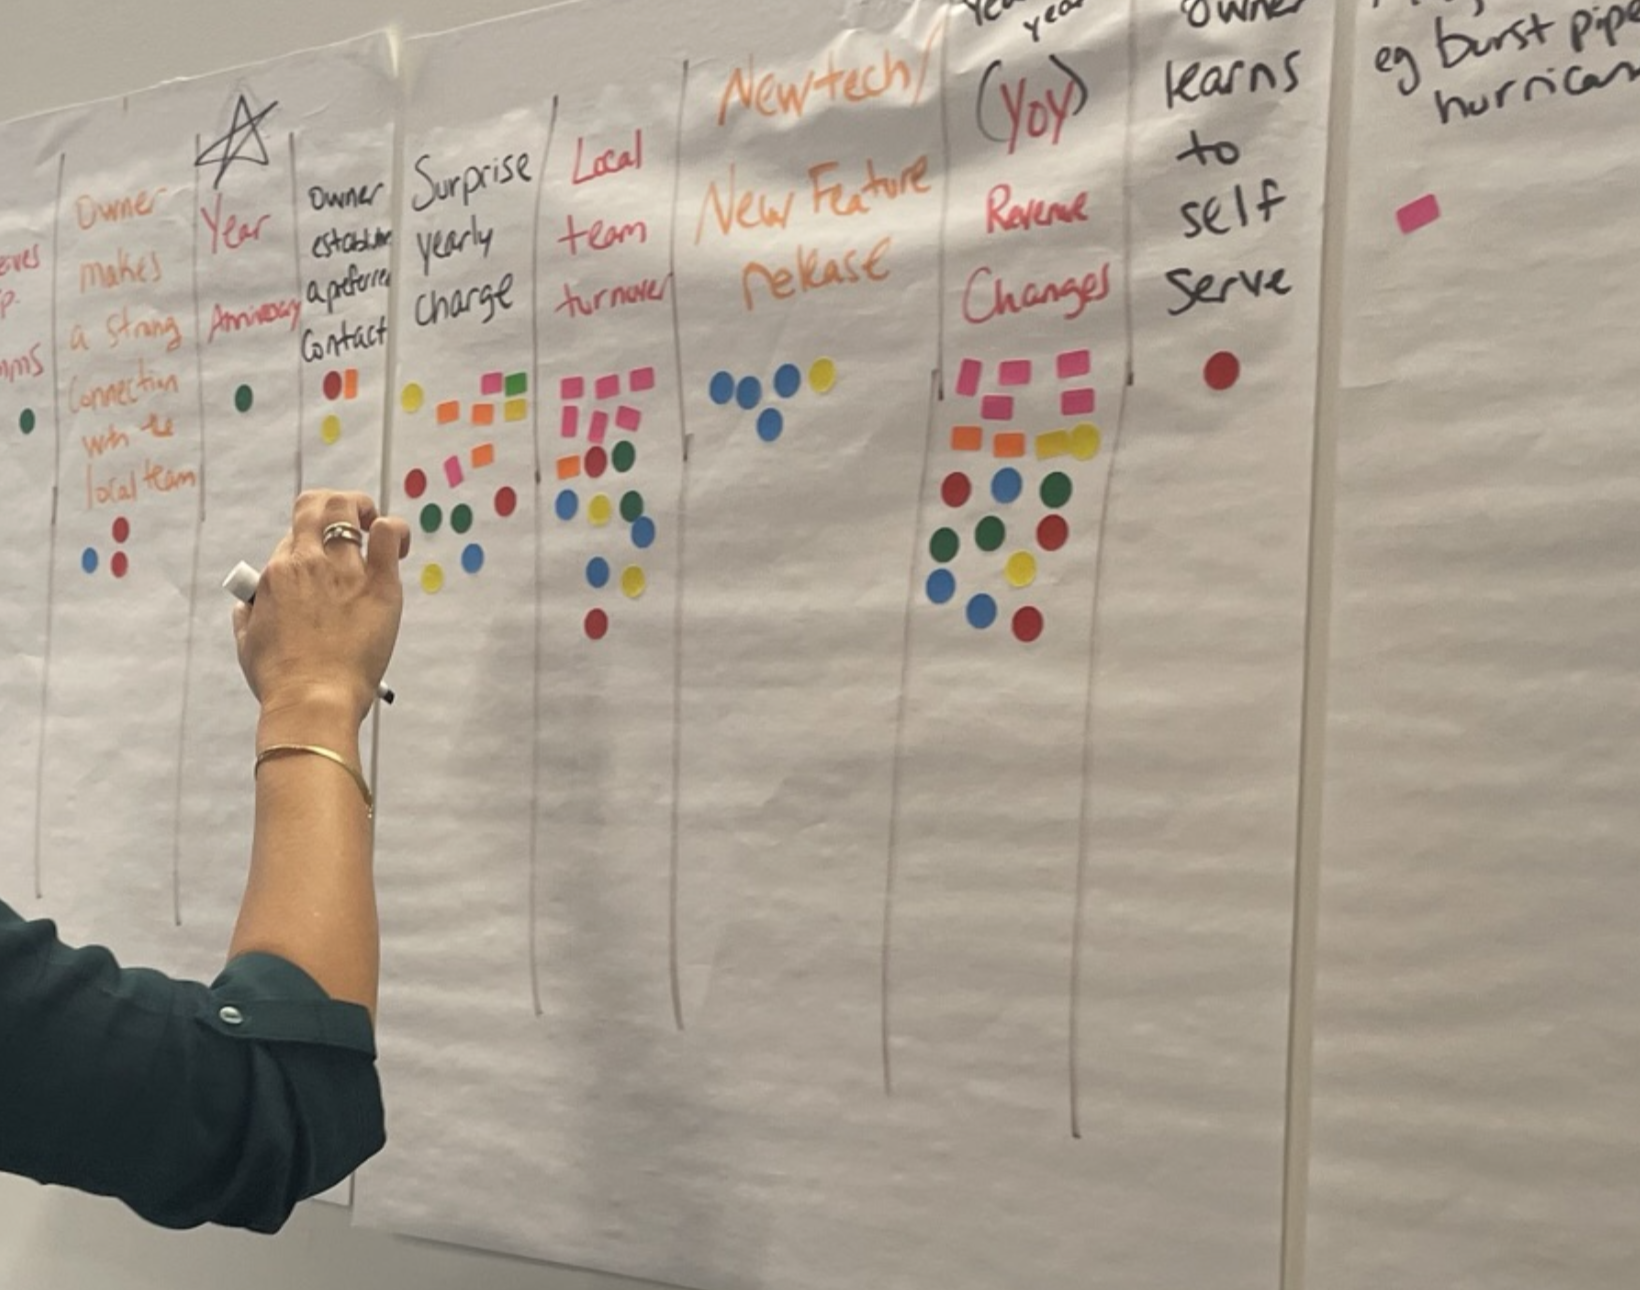
The journey skeleton was then revised and populated with more detail throughout the course of the event.
Model Development
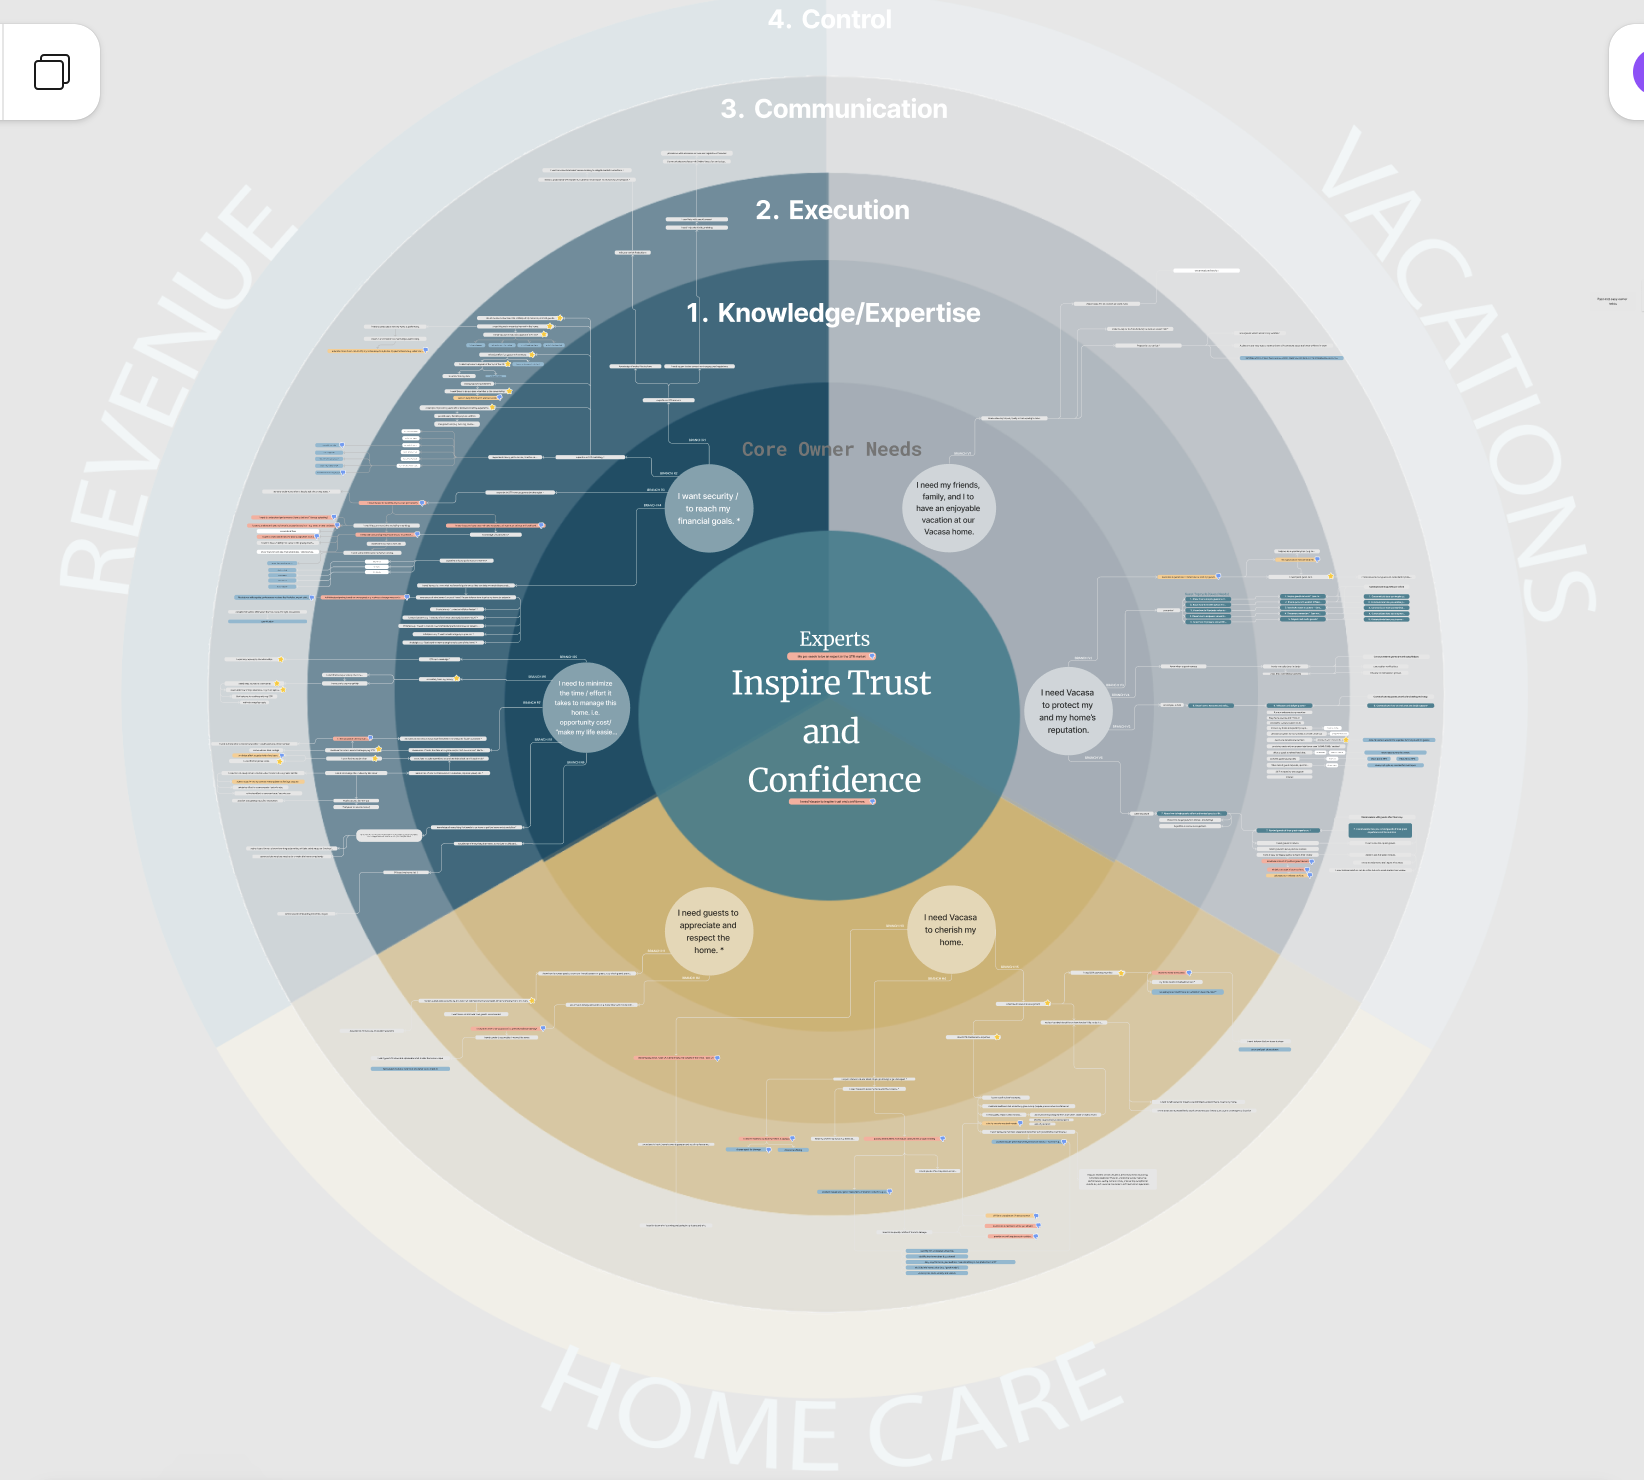
The Owner Needs Model is a tool and was developed from our v1 list of owners’ needs and includes data from the Owner Needs survey, specifically, results from the gap analysis which highlights the difference between the importance of a need vs. the owners’ level of satisfaction. the larger the gap, the larger the pain point.
By combining qualitative insights with the quantitative survey data, I was able to create a valuable artifact: a user needs model that product managers, designers, and leadership could use to help make decisions about what features and products to prioritize.
The future intent of this diagram is to also act as a library. Vacasa did not have the budget to hire a research librarian, so I wanted to create something that made it easy to understand the customer’s needs and find information about each need.
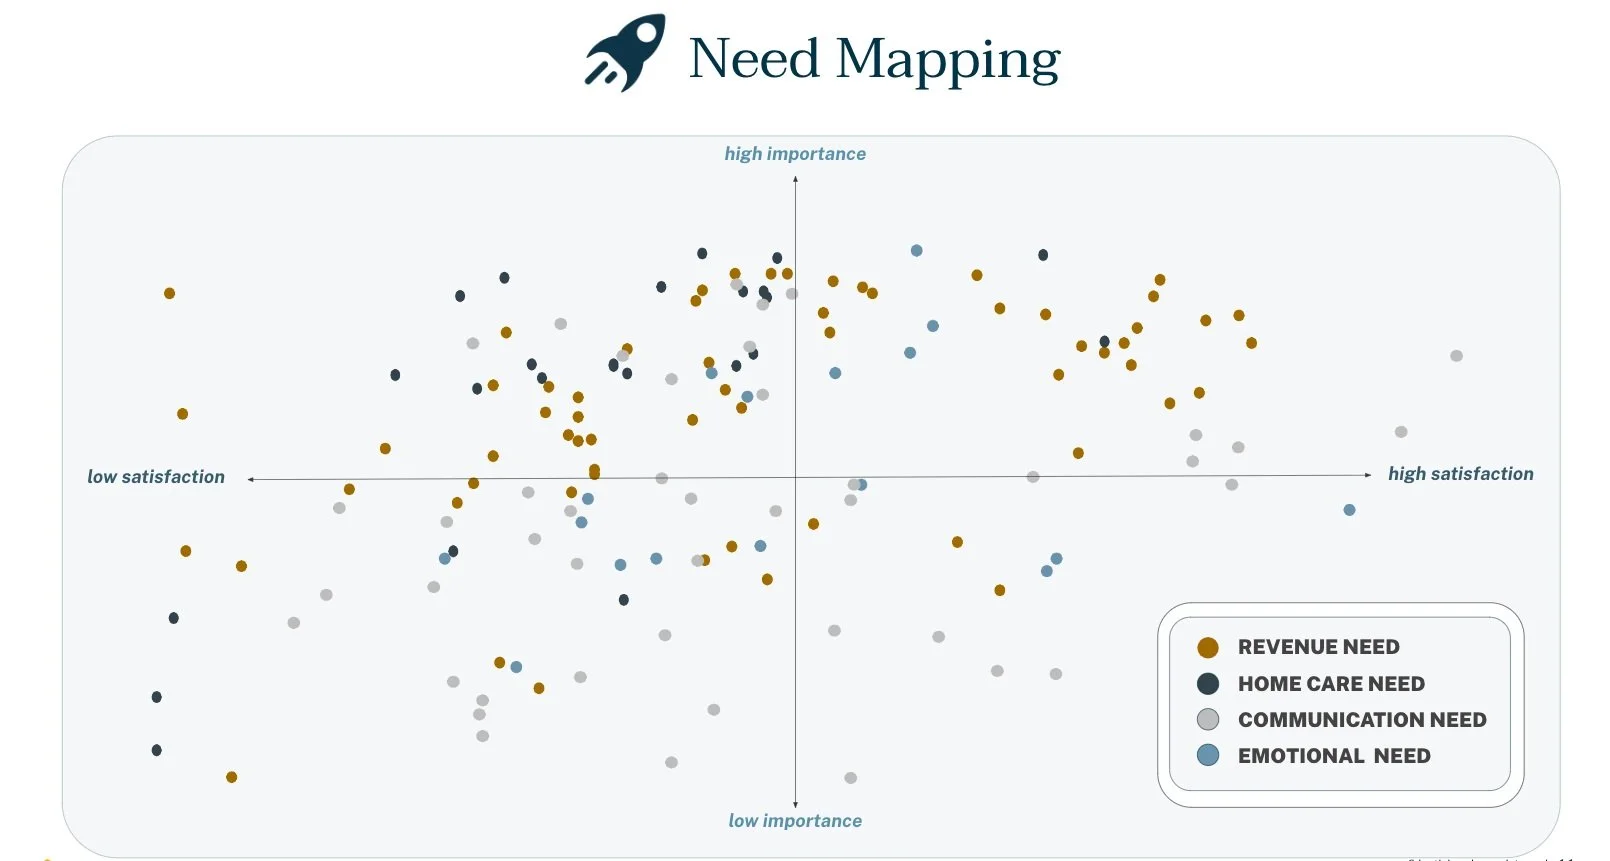
Creating a model like this also gave us the opportunity to structure data and create other helpful data visualizations like the Need Map seen here.
Research and Design Sprint:
Teresa Torres, Opportunity Trees, and an MVP
This was a high profile project and there were a lot of hands in the pot, so to speak. We had some concerns that the work was progressing too slowly, so we decided that the best course of action was to have a week long research and design sprint where our tripod cleared our schedules and met with each other a few hours each day to ideate and test concepts. Between group sessions each individual would continue to work on separate tasks related to the sprint e.g. recruitment, designing wireframes, mockups or prototypes, etc.
We focused on our foundational learnings around what users need and that they want to understand why their home is priced the way it is.
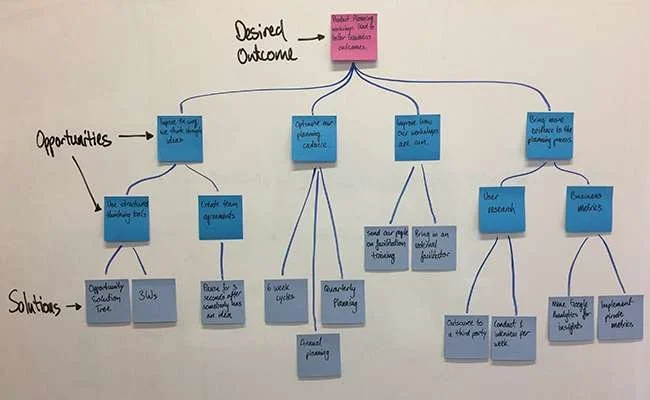
This team, myself included, closely follow Teresa Torres’s work and regularly utilize some version of her Opportunity - Solution Trees. Utilizing this method is great not only because it helps to collaboratively ideate, but it also helps to identify hypotheses and key metrics that should be monitored during a product launch.
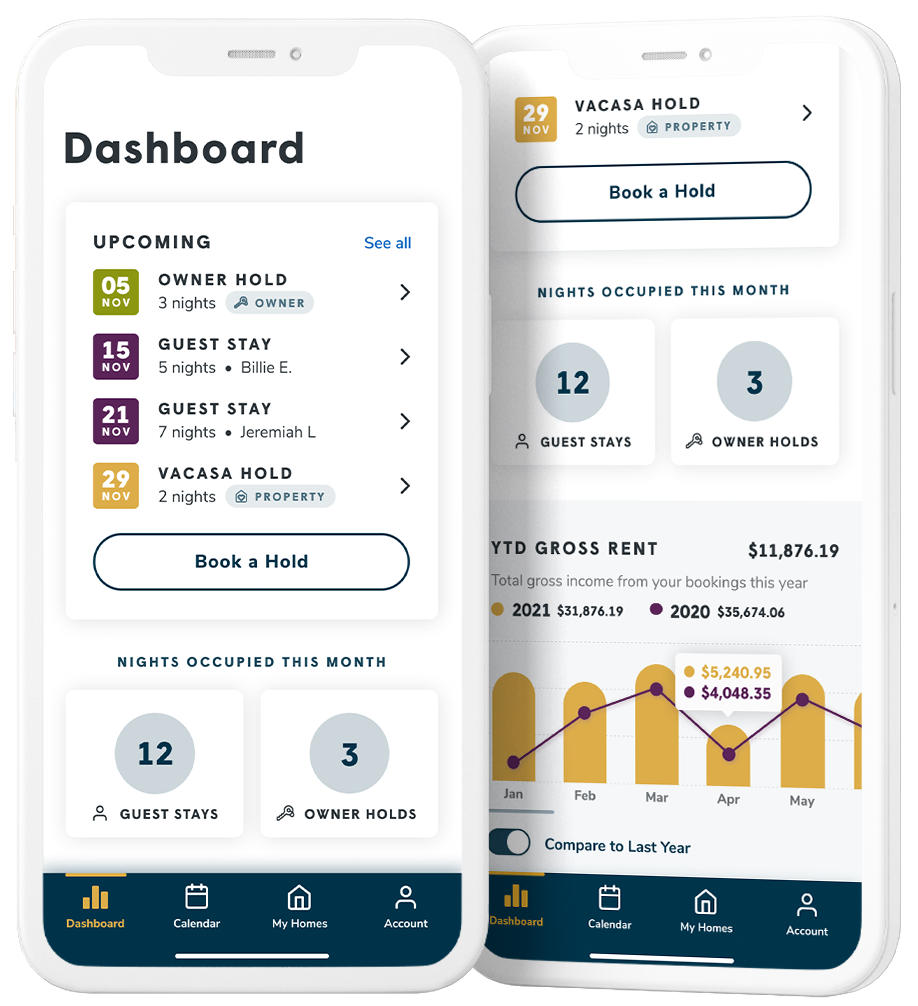
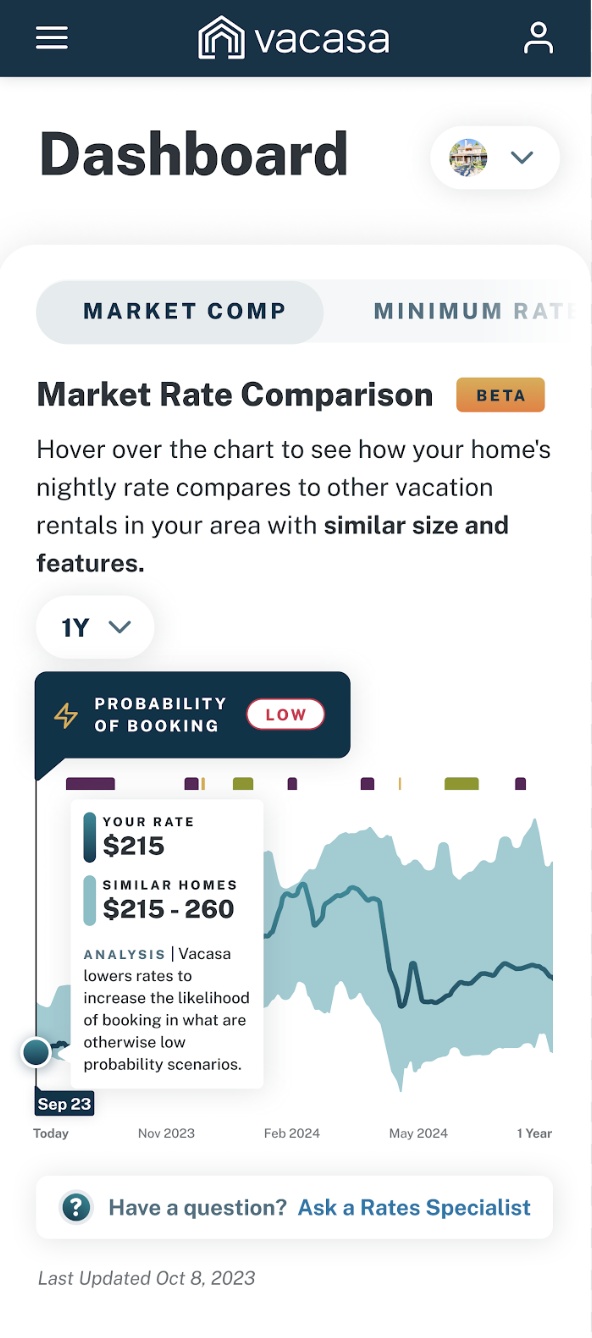
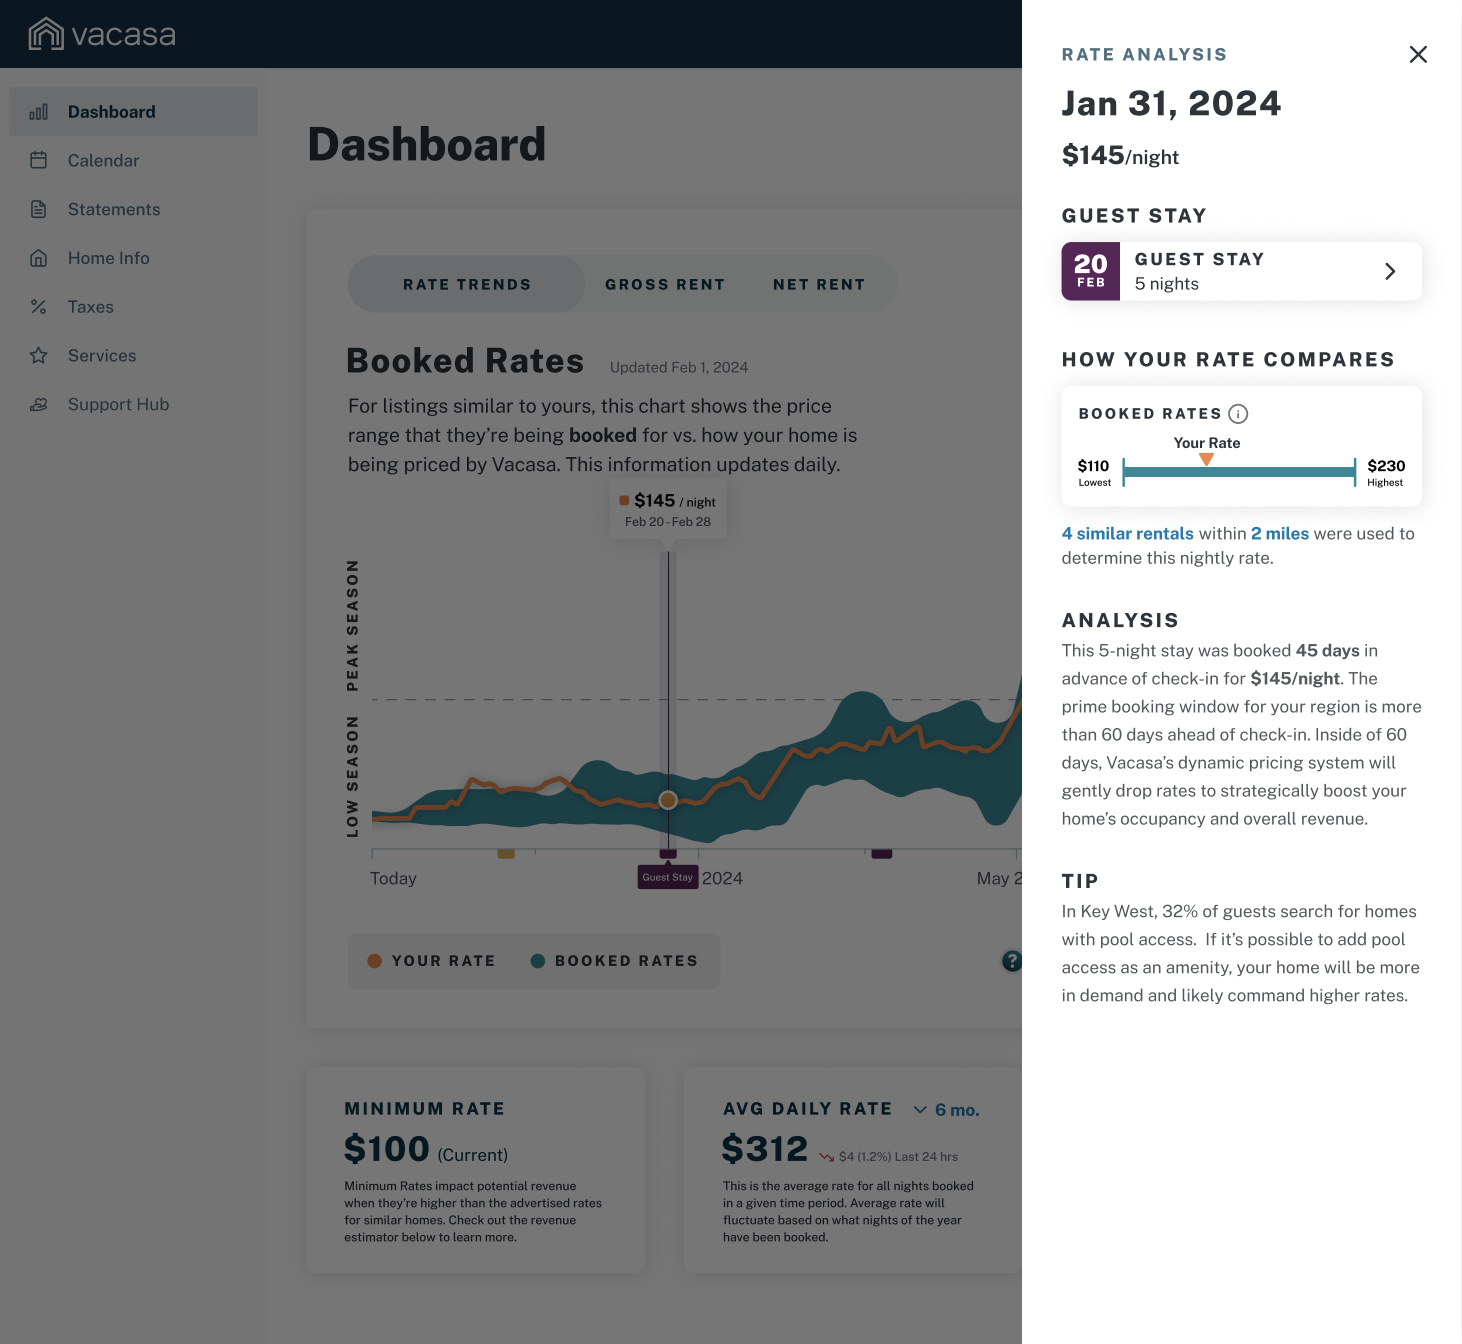
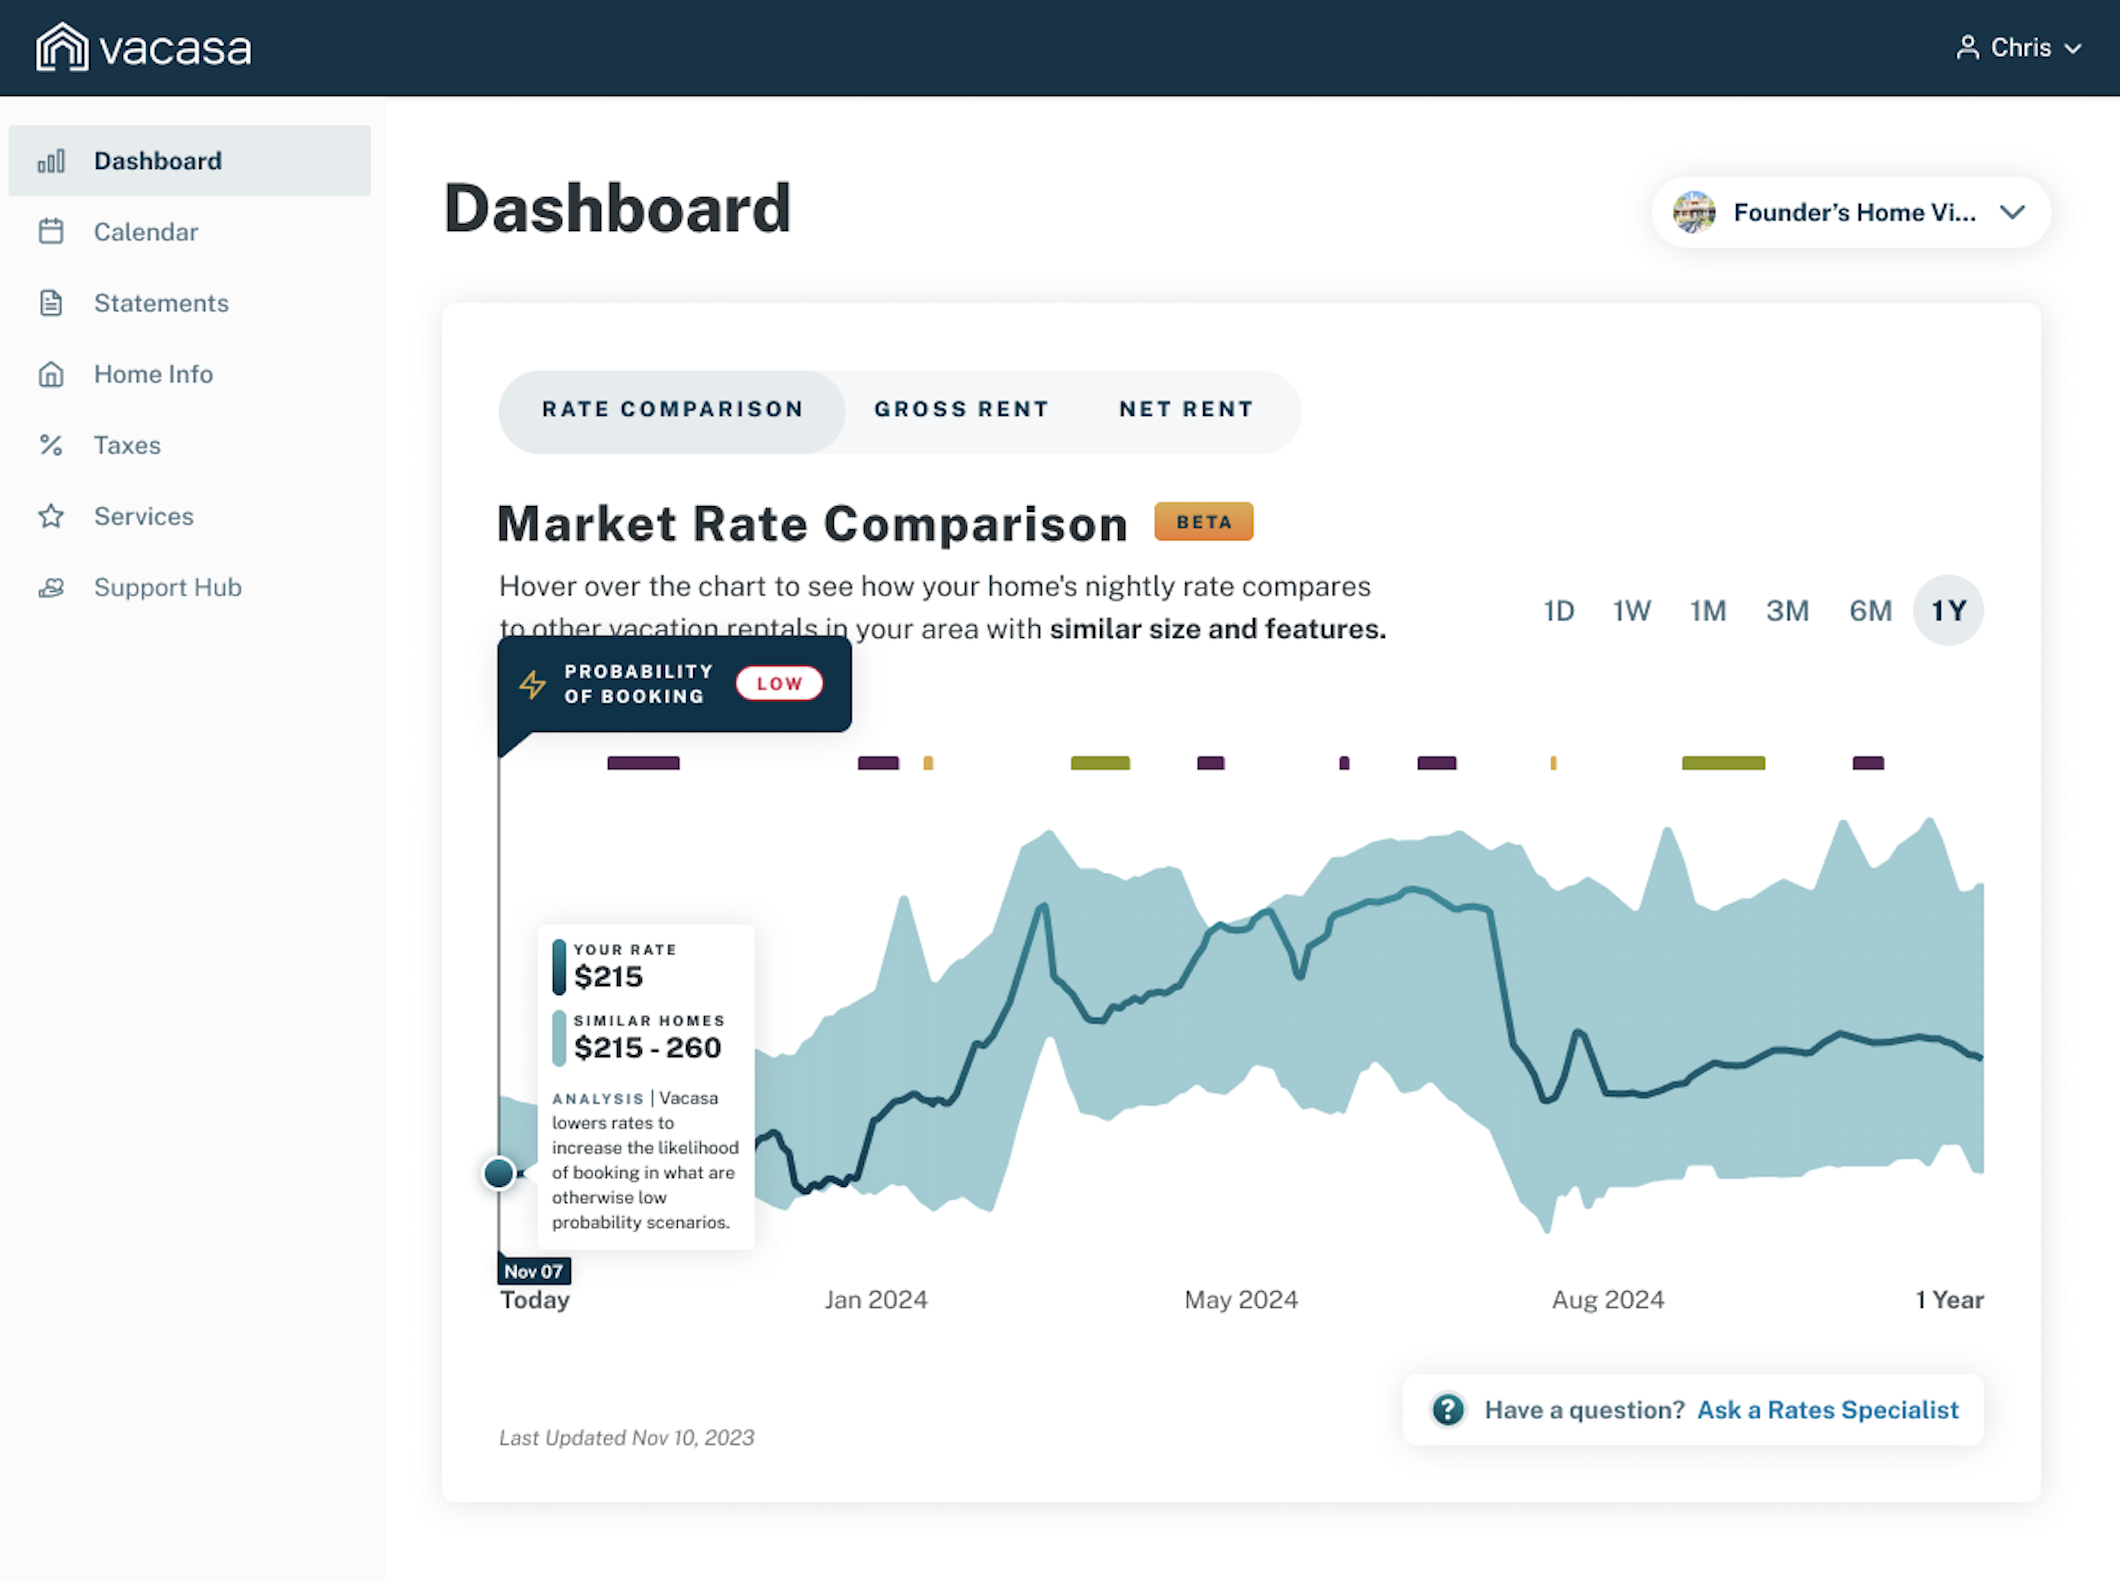
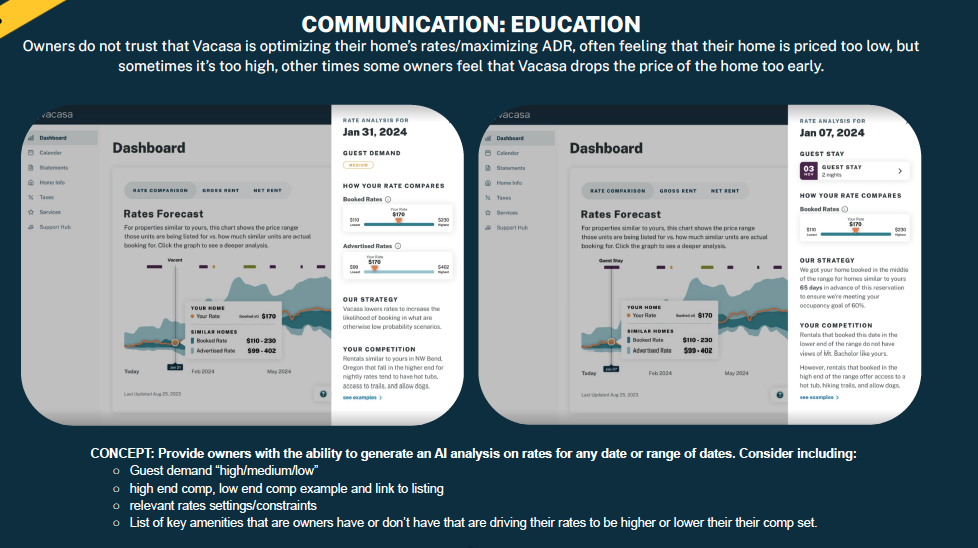
The sprint led to development of an MVP, which included a slice of features that we expected to both delight users and address their pain points. This new tool shared nearly realtime pricing data on surrounding comparable homes, customized for each homeowner.
Our designer, Dan Rattigan, created these beautiful designs and the Product Manager, Jake Pulliam, was essential our success.
Reports & Shareouts
In a large project like this, planning and communication is key. From the beginning with our proposal I set expectations on the project’s timeline and when they could expect updates. I have been planning research for years and I know how long things take. It is very rare that I fall behind my planned schedule - even so, if something sets us down a path that needs to be investigated prior to moving on, I always make sure to communicate tradeoffs.
There were also weekly ‘key initiative meetings’ with the CEO and other c-suite members. I was occasionally asked to present research updates in on these calls.
Weekly Collaboration
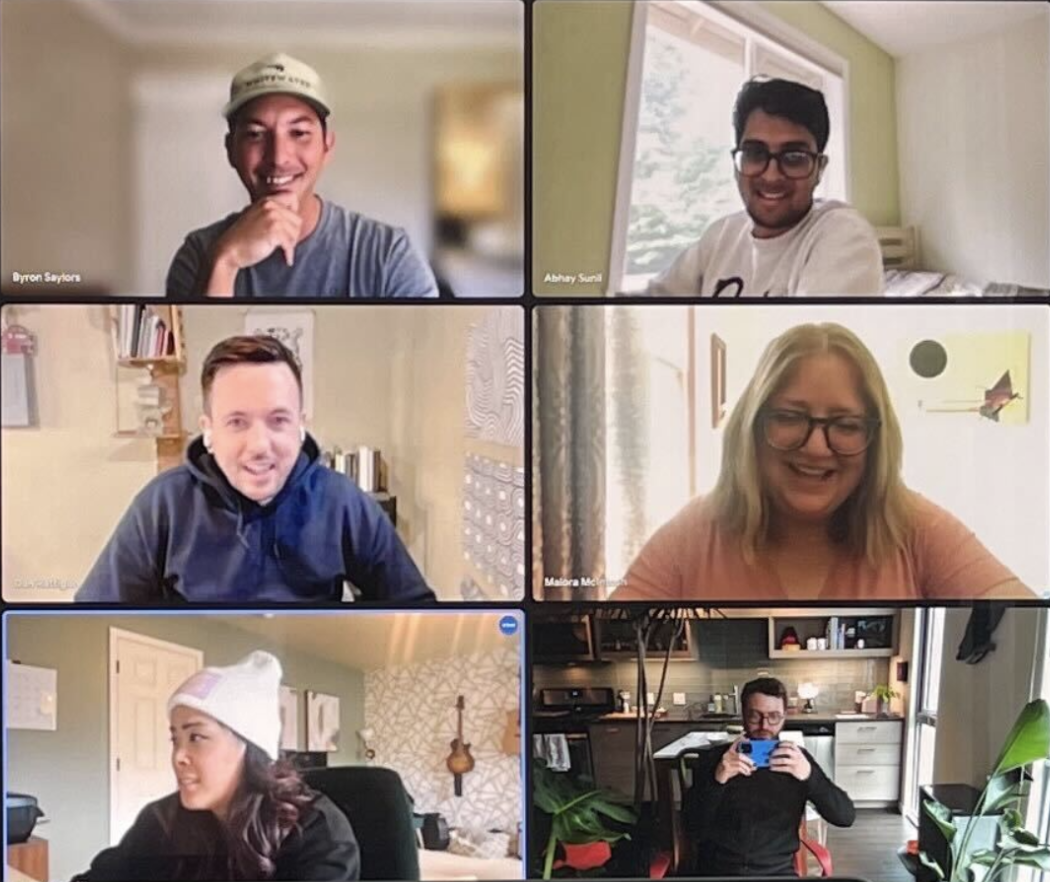
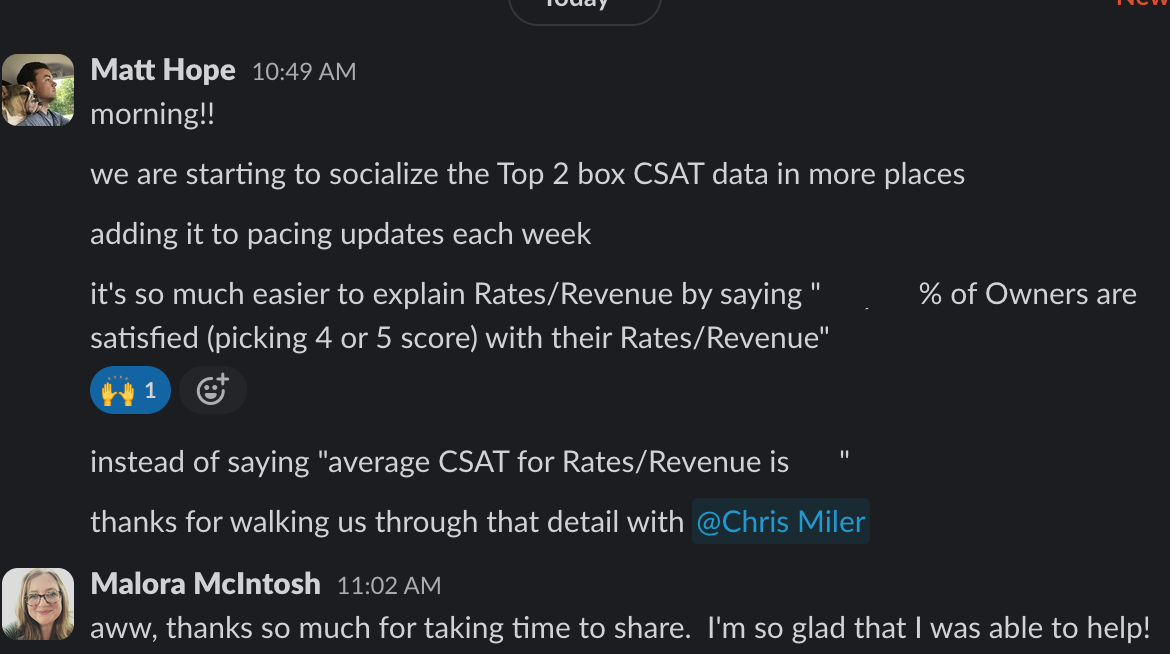
My team and extended team (stakeholders), had a standing meeting once a week. We also communicated regularly via email and slack.
Proof and Monitoring
A very cross functional process:
Our team worked closely with engineers to develop the winning concept.
To launch the proof of concept, our Product Manager, Jake Pullium, worked closely with analytics to ensure that we had a dashboard with the data that we needed. e.g. engagement.
After launch we continually refined the data that monitored and reached out to early users to get 1:1 feedback.
We had daily meetings with the customer service manager who was most familiar with the rates and revenue calls to get her feedback and impressions.
Edge cases were addressed as needed.
We partnered with product marketing to educate users on the product.
Outcome:
This collaborative effort had a significant impact on engagement and other important metrics: weekly active users increased by a whopping 30% and user submitted revenue tickets decreased by 13%.
Vision and Roadmap Planning
We had a taste of success on this project and we were hungry for more. While I am no longer involved in this work, I was involved in the vision that was created after this project wrapped up. It is likely that future iterations of this feature will be expanded to include AI generated pricing summaries and options to drill down into comparable home sets, which would let users click to explore to specific competitor listings. Again, the vision is focused on helping our users understand why their home is priced the way it is. Creating a vision and roadmap, and maintaining product-market fit becomes significantly easier when you have a comprehensive understanding of your target use, along with their needs and pain points.

